Cracking the Neural Code for Sensory Perception Through Statistics and Behavior
Combining statistics, interventions, and behavioral observations to decode the neural mechanisms underlying sensory perception, this study delves into the intricate workings of spike trains and neural information processing. Revealing insights into how the brain utilizes sensory information, the research paves the way for understanding complex neural interactions and their impact on behavior and decision-making.
Download Presentation

Please find below an Image/Link to download the presentation.
The content on the website is provided AS IS for your information and personal use only. It may not be sold, licensed, or shared on other websites without obtaining consent from the author.If you encounter any issues during the download, it is possible that the publisher has removed the file from their server.
You are allowed to download the files provided on this website for personal or commercial use, subject to the condition that they are used lawfully. All files are the property of their respective owners.
The content on the website is provided AS IS for your information and personal use only. It may not be sold, licensed, or shared on other websites without obtaining consent from the author.
E N D
Presentation Transcript
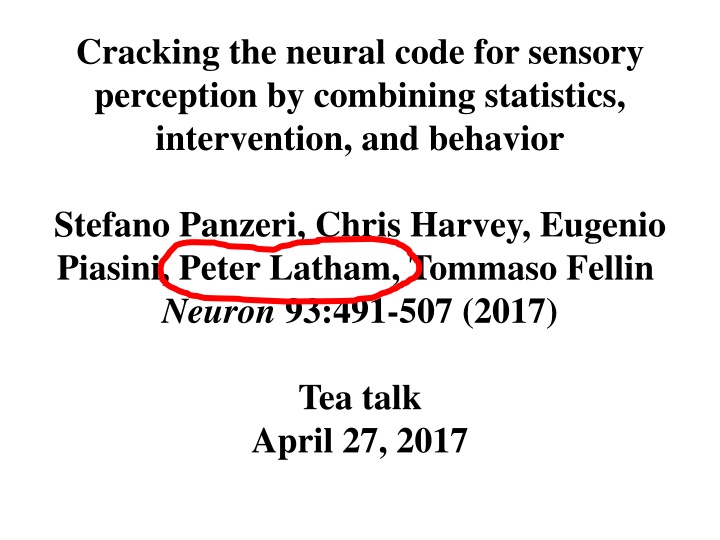
Cracking the neural code for sensory perception by combining statistics, intervention, and behavior Stefano Panzeri, Chris Harvey, Eugenio Piasini, Peter Latham, Tommaso Fellin Neuron 93:491-507 (2017) Tea talk April 27, 2017
Flash back to the 1990s, when one of the big questions was: What aspects of spike trains are important? In its simplest version, this was a question about bin size.
A typical experiment: - Show a set of stimuli (over and over) while recording from a neuron. - Bin the spike trains at a bin size of t. - Compute the information between the stimuli and spike trains versus t. A typical result: run out of data!!! info bin size ( t)
Reinagel, P. et al. J. Neurosci.20:5392-5400 (2000) anesthetized Stimulus: full-field, high-contrast, new frame every 7.8 ms.
However, just because information is contained in spike timing doesn t mean the brain uses that information. The million pound question: does the brain use information at fine timescales? This paper proposes a methodology for answering that question, except more generally than just bin size.
The idea is to define intersection information which is the set of neural features carrying sensory information that is read out to inform a behavioral choice .
An example: bin spikes at 0.5 s. show stimulus record spikes r1 = 4 r2 = 3 0 0.5 1 time (s)
An example: But suppose the decoder was based on the total spike count. r2 s1 s2 r1
An example: But suppose the decoder was based on the total spike count. r2 s1 s2 choice boundary r1
An example: stimulus boundary r2 s1 s2 choice boundary r1 Loosely, the intersection information is zero if the stimulus and choice boundaries are orthogonal.
An example: stimulus boundary r2 s1 s2 choice boundary r1 Loosely, the intersection information is high if the stimulus and choice boundaries are the same.
An example: stimulus boundary r2 s1 s2 choice boundary r1 Loosely, the intersection information is in between if the stimulus and choice boundaries partially line up.
It turns out to be hard to come up with a rigorously justified definition of intersection information. But suppose we use, for now, the degree to which stimulus and choice boundaries line up as a measure of intersection information. How might we measure it experimentally?
An easy case: r2 Visual Stimulus r1
In that case, the decision boundaries tell you everything: stimulus boundary r2 s1 s2 choice boundary r1
But its never that simple. r2 Visual Stimulus r1
Two reasons why naively measuring intersection information will give wrong answers.
Reason #1. true choice boundary true stimulus boundary r2 s1 s2 r1 Actual choice made by the animal depends only on r1. You record only from r2.
Reason #1. true choice boundary true stimulus boundary r2 s1 r2 choice boundary s2 r1 Actual choice made by the animal depends only on r1. You record only from r2.
Reason #1. true choice boundary true stimulus boundary r2 s1 r2 stimulus boundary r2 choice boundary s2 r1 Actual choice made by the animal depends only on r1. You record only from r2. It looks like r2 has high intersection information!
Reason #2. stimulus boundary r2 s1 s2 choice information r1 r1 r2 r1 + r2 s choice ~ ar3 + b(r1 + r2) r3 carries stimulus information
Reason #2. choice boundary stimulus boundary r2 s1 s2 choice information r1 r1 r2 r1 + r2 s choice ~ ar3 + b(r1 + r2) r3 carries stimulus information
optogenetically perturbing r2 will have no effect on choice! true choice boundary true stimulus boundary r2 s1 s2 r1 Actual choice made by the animal depends only on r1. You record only from r2.
optogenetically perturbing r1 and r2in the stimulus direction will have no effect on choice! stimulus boundary r2 s1 s2 choice boundary r1 r1 r2 r1 + r2 s choice ~ ar3 + b(r1 + r2) r3 carries stimulus information
The grand conclusion: - It s difficult, but possible (we believe), to define intersection information. - It can only be measured using neural coding techniques to determine the stimulus-response mapping, and optogenetics to determine causal relationships between activity and choices. - In practice, it s difficult because more than two neurons are involved!
