Create Ternary Diagrams and More with Gtplot from GSS
Explore how to generate ternary diagrams, cross-plots, and time series graphs with Gtplot using GSS. Customize markers, toggle gridlines, labels, and more to visualize fluid composition effectively. Take control of diagram components and sample display for comprehensive data analysis.

Download Presentation

Please find below an Image/Link to download the presentation.
The content on the website is provided AS IS for your information and personal use only. It may not be sold, licensed, or shared on other websites without obtaining consent from the author. If you encounter any issues during the download, it is possible that the publisher has removed the file from their server.
You are allowed to download the files provided on this website for personal or commercial use, subject to the condition that they are used lawfully. All files are the property of their respective owners.
The content on the website is provided AS IS for your information and personal use only. It may not be sold, licensed, or shared on other websites without obtaining consent from the author.
E N D
Presentation Transcript
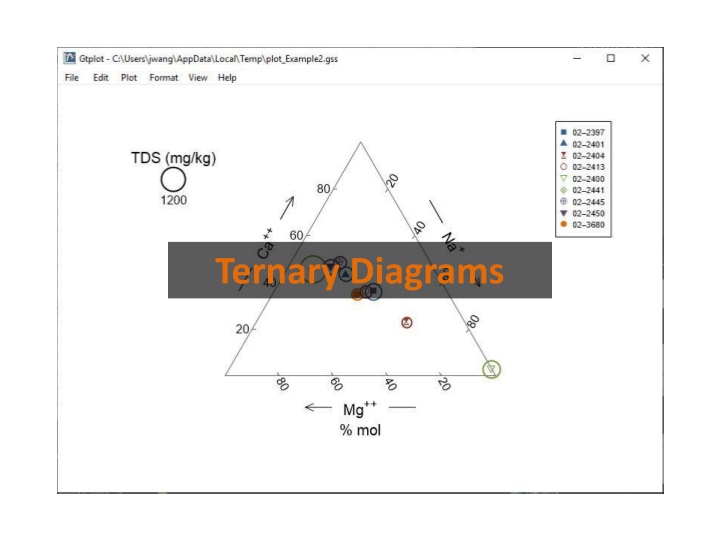
You can launch Gtplot from GSS to create Ternary diagrams, cross-plots, time series graphs, and more. Plot Ternary Diagram You can set the color, shape, or size of markers representing individual samples or analytes.
The Ternary diagram shows fluid composition on a tri-linear plot. Double-click on plot to bring up the Ternary diagram configuration dialog. Double-click outside the plot to open the Quick Toggle dialog. Toggle gridlines, sample labels, legend, and more. Right-click on labels or axes to change color, font, size, etc.
Choose components for the diagram. You control details of the Ternary diagram from the Plot pane. Units expressed as fractions. Toggle TDS circles, scale, units, display, etc.
You control which samples are displayed from the Samples pane. You can cycle through samples one at a time. Only selected samples in the Available list plot. Plot all samples together.


