Creating Accessible Presentations Guide
Sample slides to help you create accessible PowerPoint presentations, ensuring readability and inclusivity for all attendees. Guidelines include font sizes, text formatting tips, importance of slide formats, graphic usage, multimedia considerations, and ways to enhance accessibility for individuals with disabilities.

Download Presentation

Please find below an Image/Link to download the presentation.
The content on the website is provided AS IS for your information and personal use only. It may not be sold, licensed, or shared on other websites without obtaining consent from the author.If you encounter any issues during the download, it is possible that the publisher has removed the file from their server.
You are allowed to download the files provided on this website for personal or commercial use, subject to the condition that they are used lawfully. All files are the property of their respective owners.
The content on the website is provided AS IS for your information and personal use only. It may not be sold, licensed, or shared on other websites without obtaining consent from the author.
E N D
Presentation Transcript
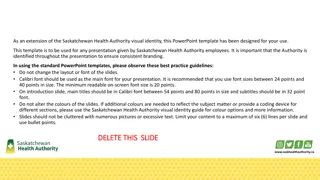
Creating Accessible Presentations Creating Accessible Presentations We hope these sample slides will help you create accessible presentations so that all attendees can access your contents. [leave about one inch of bottom space clear for captions DELETE THIS TEXT]
Overview Overview This template is a guide for creating accessible PowerPoint presentations. This template uses fonts, font sizes and color selections, and color contrasts to improve readability. [leave about one inch of bottom space clear for captions DELETE THIS TEXT]
Font and Presentation Length Font and Presentation Length Font size of slide title fonts should be 36 pt. or greater. Text fonts should be 24 pt. or greater. Don t try to cram too many slides into your presentation. Allow your audience time to read slides. [leave about one inch of bottom space clear for captions DELETE THIS TEXT]
Text Formatting Text Formatting Place no more than 6 lines of text on a slide (excluding columns). [leave about one inch of bottom space clear for captions DELETE THIS TEXT]
Importance of Slide Format Importance of Slide Format Many people with disabilities use text-based screen reading software and computer devices. However, graphics cannot be read with screen readers and other text-based devices. [leave about one inch of bottom space clear for captions DELETE THIS TEXT]
Graphics Graphics Replace graphics with text whenever possible. Include a text slide after each picture/graph slide that describes what is seen in the picture/graph. [leave about one inch of bottom space clear for captions DELETE THIS TEXT]
Multimedia Multimedia Provide text description of visuals in a multimedia presentation. Provide captioning of audio for hearing impaired persons. Ensure that sound is audible from all points in the room. [leave about one inch of bottom space clear for captions DELETE THIS TEXT]
Avoid Avoid Slide transitions Busy slide backgrounds Chart filler patterns Over-crowding text Color schemes providing low contrast Charts without text descriptions [leave about one inch of bottom space clear for captions DELETE THIS TEXT]
Charts Charts Use contrasting colors Use the slide title as the chart title. Font size for chart labels: 20 pt or greater. Favor clarity over quantity of content. Chart description slides. [leave about one inch of bottom space clear for captions DELETE THIS TEXT]
Presentation Title Here Presentation Title Here Presenter Names Here [leave about one inch of bottom space clear for captions DELETE THIS TEXT]
Bar Chart Example Bar Chart Example 35 30 25 20 15 10 5 0 1st Qtr 2nd Qtr 3rd Qtr 4th Qtr 2011 2012 2013 2014 2015 2016 2017 [leave about one inch of bottom space clear for captions DELETE THIS TEXT]
Text Description for Bar Graph Example Text Description for Bar Graph Example Reading left to right horizontally across columns: 2011 = 2, 5, 7, 10 2012 = 4, 7, 9, 15 2013 = 6, 9, 11, 20 2014 = 8, 11, 13, 25 2015 = 10, 13, 15, 30 2016 = 12, 15, 17, 31 2017 = 14, 20, 19, 33 [leave about one inch of bottom space clear for captions DELETE THIS TEXT]
Alternative Bar Chart Example Alternative Bar Chart Example 35 30 25 20 15 10 5 0 1st Qtr 2 4 6 8 10 12 14 2nd Qtr 5 7 9 11 13 15 20 3rd Qtr 7 9 11 13 15 17 19 4th Qtr 10 15 20 25 30 31 33 2011 2012 2013 2014 2015 2016 2017 2011 2012 2013 2014 2015 2016 2017 [leave about one inch of bottom space clear for captions DELETE THIS TEXT]
Thank You This PowerPoint was created by the ADA Programs Division (510) 238-5219 adaprograms@oaklandca.gov [leave about one inch of bottom space clear for captions DELETE THIS TEXT]