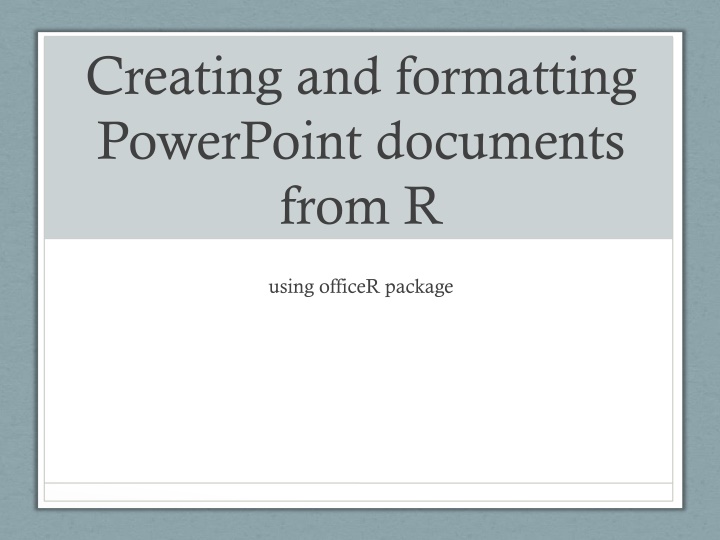
Creating and formatting PowerPoint documents from R
"Learn how to generate and format PowerPoint documents in R using the officeR package, which offers functionalities like automating reporting, utilizing MS templates, and formatting complex tables. Get started by installing the required packages and explore features such as generating title slides and using different layouts."
Download Presentation

Please find below an Image/Link to download the presentation.
The content on the website is provided AS IS for your information and personal use only. It may not be sold, licensed, or shared on other websites without obtaining consent from the author.If you encounter any issues during the download, it is possible that the publisher has removed the file from their server.
You are allowed to download the files provided on this website for personal or commercial use, subject to the condition that they are used lawfully. All files are the property of their respective owners.
The content on the website is provided AS IS for your information and personal use only. It may not be sold, licensed, or shared on other websites without obtaining consent from the author.
E N D
Presentation Transcript
Creating and formatting PowerPoint documents from R using officeR package
Overview OfficeR became available in mid-2017, currently on version 0.3.1 Previous option: ReporteRs, same author. Important drawback - Java requirement Important functionalities: Automates reporting, allows using MS templates Lets the user format any complex table Incorporates editable vector graphics 2
Getting Started - Install R - [Install R Studio] - Install and load the package: install.packages('officer') library(officer) # Package `magrittr` makes # officer usage easier library(magrittr) 3
Generating Title Slide officeR_example <- read_pptx("blank.pptx") ## Title slide officeR_example <- add_slide(officeR_example, layout='Title Slide', master='Capital') officeR_example <- ph_with_text(officeR_example, type = 'ctrTitle', str = 'Creating and formatting PowerPoint documents from R') officeR_example <- ph_with_text(officeR_example, type = 'subTitle', str = 'using officeR package') 4
Title Slide Using Piping library(magrittr) officeR_example <- officeR_example %>% add_slide(layout='Title Slide', master='Capital') %>% ph_with_text(type = 'ctrTitle', str = 'Creating and formatting PowerPoint documents from R') %>% ph_with_text(type = 'subTitle', str = 'using officeR package') 5
Available layouts layout master Title Slide Capital Content, Picture, and Caption Capital Picture with Caption Capital Picture above Caption Capital Title and Vertical Text Capital Vertical Title and Text Capital Title and Content Capital Title Slide with Picture Capital Section Header Capital Two Content Capital Comparison Capital Title Only Capital Blank Capital Content with Caption Capital 6
Generating Overview Slide officeR_example <- officeR_example %>% add_slide(layout='Title and Content', master='Capital') %>% ph_with_text(type = 'title', str = 'Overview') %>% ph_with_ul(type = 'body', str_list = c('Bullet Point 1', 'Bullet Point 2', 'Bullet Point 3', 'Bullet Sub-Point 3.1', 'Bullet Sub-Point 3.2', 'Bullet Sub-Point 3.3'), level_list = c(1, 1, 1, 2, 2, 2)) %>% ph_with_text(type = 'sldNum', str = '2') 7
Adding ggplot Object Mileage by Gear Number 35 30 Miles per Gallon gear 25 3gears 4gears 5gears 20 15 10 3gears 4gears 5gears 8
Code for Adding ggplot Object # Create a my_gg_plot object first using my_gg_plot = ggplot([...]) officeR_example <- officeR_example %>% add_slide(layout='Title and Content', master='Capital') %>% ph_with_text(type = 'title', str = 'Adding ggplot Object') %>% ph_with_vg(code = print(my_gg_plot), type = 'body') 9
