Creating Custom Reports in SAS: Mastering Proc Report
Learn how to create custom reports in SAS using Proc Report, a procedure that allows you to generate professional data reports and summaries. Understand the syntax, column statements, and defining variables for effective report generation tailored to your needs.

Download Presentation

Please find below an Image/Link to download the presentation.
The content on the website is provided AS IS for your information and personal use only. It may not be sold, licensed, or shared on other websites without obtaining consent from the author. If you encounter any issues during the download, it is possible that the publisher has removed the file from their server.
You are allowed to download the files provided on this website for personal or commercial use, subject to the condition that they are used lawfully. All files are the property of their respective owners.
The content on the website is provided AS IS for your information and personal use only. It may not be sold, licensed, or shared on other websites without obtaining consent from the author.
E N D
Presentation Transcript
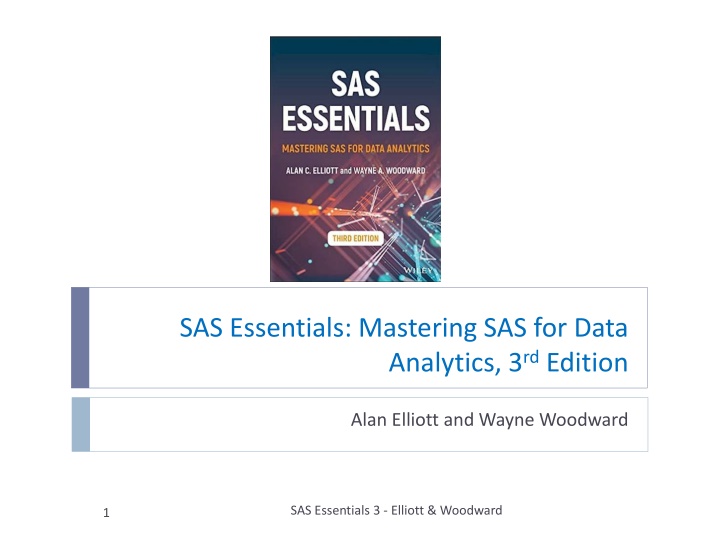
SAS Essentials: Mastering SAS for Data Analytics, 3rdEdition Alan Elliott and Wayne Woodward SAS Essentials 3 - Elliott & Woodward 1
Chapter 20: CREATING CUSTOM REPORTS PART 2 These slides are provided to help you use to teach SAS using SAS Essentials, 3rd Edition (Elliott and Woodward). Feel free to modify them for your own needs. Please send comments about errors in the slides (or suggestions for improvements) to sas@alanelliott.com. Files available at www.alanelliott.com/sas. Thanks 2 SAS Essentials 3 - Elliott & Woodward
LEARNING OBJECTIVES To be able to create custom reports using PROC TABULATE To be able to create custom reports using PROC REPORT To be able to create a custom report using the DATA step 3 SAS ESSENTIALS -- Elliott & Woodward
Where to Get Hands-On Data Files As discussed in Chapter 1, the files used in the examples are located on the web at http//:www.alanelliott.com/sas Refer to the information in the first tutorial, or in the SAS ESSENTIALS text for additional information on how to download these files from the web, and copy them to you computer. 4 SAS Essentials 3 - Elliott & Woodward
20.2 USING PROC REPORT PROC REPORT is a procedure in SAS that allows you to create professional data reports and summaries. The syntax for PROC REPORT is a little different from most statistical procedures because it has a particular emphasis on defining the columns of the report: PROC REPORT DATA= sasdataset <options>; COLUMN variables and specifications; DEFINE column / attributes; COMPUTE column; compute statements; ENDCOMP; RUN; 5 SAS ESSENTIALS -- Elliott & Woodward
The COLUMN Statement in PROC REPORT The COLUMN statement is used to identify variables of interest to be reported in columns and to specify headers and groups. Every column you want to display in the table must be indicated in the COLUMN statement. A simple report would be PROCREPORT DATA=MYSASLIB.CARS NOFS; COLUMN BRAND CITYMPG HWYMPG; RUN; which is about the same as a PROC PRINT. To enhance the report requires a DEFINE statement. 6 SAS ESSENTIALS -- Elliott & Woodward
The DEFINE Statement in PROC REPORT The DEFINE statement is used to specify the appearance of the columns. Its syntax is DEFINE report-item /<Option(s)>; DEFINE specifies variable attributes that determine how it is displayed. Options follow a slash(/). Options can be of several types: options that describe how to use a variable; options that control column headings; options that customize a report item; other options for a report item. For example: DEFINE AGE/DISPLAY 'A Label' FORMAT=6.1; 7 SAS ESSENTIALS -- Elliott & Woodward
Table 20.14 PROC REPORT DEFINE (Report-Items) Name Purpose DISPLAY Display the indicated the variable in the column. This is the default. DEFINE SBP/DISPLAY; ORDER Sorts data and forms groups GROUP Group (consolidate) observations using the specified variable. For example DEFINE BRAND/GROUP; Displays records grouped by BRAND. Defines a variable used to calculate a statistic within the cell of a report. Begins and ends a code segments that calculates a data value. Create groups across page rather than down the page ANALYSIS COMPUTE and ENDCOMP ACROSS 8 SAS ESSENTIALS -- Elliott & Woodward
Table 20.15 PROC REPORT DEFINE Statement Option Attributes Attributes FORMAT = format LABEL Example Example FORMAT=6.1 Example Model Type Or Model/Type to split title. Any statistic that is available in PROC MEANS. For example N, MEAN, SUM, or STD. (DATA, FORMATTED, FREQ or INTERNAL) same as in PROC FREQ. Use DESCENDING option to reverse normal ascending order. STATISTICNAME ORDER=ordertype 9 SAS ESSENTIALS -- Elliott & Woodward
The /DISPLAY Option in the DEFINE Statement The DEFINE var/DISPLAY option in the DEFINE statement allows you to specify attributes for that variable including format and labels. For example, DEFINE AGE/DISPLAY 'Age/2000' FORMAT=6.1; Just as the split character / in a label indicates to go to the next line, so the label 'Age/2000' is displayed on two lines. Note in the LABEL example that the default split character is a slash (/). However, it can be defined as a different character in the PROC REPORT statement. For example, SPLIT='*' makes the asterisk the split character. The following Hands-on Examples illustrate several uses of the DEFINE option. 10 SAS ESSENTIALS -- Elliott & Woodward
DO HANDS-ON EXAMPLE 20.7 Open the program file AREPORT1.SAS PROCREPORT DATA=MYSASLIB.CARS NOFS; COLUMN BRAND MODEL CITYMPG HWYMPG; DEFINE CITYMPG/DISPLAY FORMAT=6.1 'CITY/MPG'; RUN; This causes CITY and MPG to appear on different lines (split) Note: The NOFS option turns off an older option that is rarely used nowadays. We do not discuss it here.) 11 SAS ESSENTIALS -- Elliott & Woodward
Resulting Report (Part of Report Shown) Note the columns shown are because of COLUMN BRAND MODEL CITYMPG HWYMPG; The DISPLAY option CITYMPG/DISPLAY FORMAT=6.1'CITY/MPG formatted this column. 12 SAS ESSENTIALS -- Elliott & Woodward
Add DISPLAY options for HWYMPG, and ENGINESIZE Note COLUMN BRAND MODEL CITYMPG HWYMPG ENGINESIZE; DEFINE CITYMPG/DISPLAY FORMAT=6.1 'CITY/MPG'; DEFINE HWYMPG/DISPLAY FORMAT=6.1 'HWY/MPG'; DEFINE ENGINESIZE/DISPLAY FORMAT=6.1 'ENGINE/SIZE'; 13 SAS ESSENTIALS -- Elliott & Woodward
ORDER Option in the DEFINE Statement The DEFINE var I ORDER option defines a column variable used to sort the data. Use the DESCENDING option to reverse the order. PROCREPORT DATA=MYSASLIB.CARS NOFS; COLUMN BRAND CITYMPG HWYMPG; DEFINE BRAND/ORDER 'Brand'; 14 SAS ESSENTIALS -- Elliott & Woodward
DO HANDS ON EXAMPLE 20.8 Open the program file AREPORT2.SAS TITLE "PROC REPORT ORDER Example"; PROCREPORT DATA=MYSASLIB.CARS NOFS; COLUMN BRAND CITYMPG HWYMPG; DEFINE BRAND/ORDER 'Brand'; DEFINE CITYMPG/DISPLAY FORMAT=6.1 'City MPG'; DEFINE HWYMPG/DISPLAY FORMAT=6.1 'Highway MPG'; RUN; The DEFINE statements sets the first column as BRAND (in ORDER) followed by columns for CITYMPG and HWYMPG 15 SAS ESSENTIALS -- Elliott & Woodward
Ordered by BRAND. Result of Order Note that the DEFINE BRAND/ORDER statement caused the report to be ordered by BRAND, with ACURA as the first brand listed. 16 SAS ESSENTIALS -- Elliott & Woodward
Now last BRAND appears first in the listing. Change Direction Change the order direction by putting DESCENDING after BRAND/ORDER. BRAND/ORDER DESCENDING Rerun and verify that now VOLVO appears as the first brand in the report. 17 SAS ESSENTIALS -- Elliott & Woodward
More ORDER options Replace the DESCENDING with ORDER=DATA so that it reads DEFINE BRAND/ORDER ORDER=DATA 'Brand' Ordered by Brand, but by the order in which each brand was originally in the dataset. Toyota was the first in the dataset. 18 SAS ESSENTIALS -- Elliott & Woodward
Use Two ORDER Options COLUMN BRAND CITYMPG HWYMPG CYLINDERS; DEFINE BRAND/ORDER ORDER=DATA 'Brand'; DEFINE CYLINDERS /ORDER 'Cylinders'; Ordered by CYLINDERS within BRAND 19 SAS ESSENTIALS -- Elliott & Woodward
Remove the ORDER=DATA, Rerun Now back to Alphabetic Order of BRAND 20 SAS ESSENTIALS -- Elliott & Woodward
The GROUP Option in the DEFINE Statement The DEFINE var/GROUP option causes the table to be grouped by the specified variable. Requests MEAN for both CITYMPG and HWYMPG. If we hadn t requested MEAN, all car MPG would be listed instead of means. DO HANDS-ON EXAMPLE 20.9 Open the program file AREPORT3.SAS PROCREPORT DATA=MYSASLIB.CARS NOFS; COLUMN BRAND (CITYMPG HWYMPG), MEAN; DEFINE BRAND/GROUP; DEFINE CITYMPG/DISPLAY FORMAT=6.1 'CITY MPG'; RUN; Assigns a format to CITYMPG 21 SAS ESSENTIALS -- Elliott & Woodward
PROC Report Using GROUP Option Results Report is grouped by Brand because of the statement DEFINE BRAND/GROUP; Notice that the format defined for MEAN for CityMPG is also used for HwyMPG because of the statement COLUMN BRAND (CITYMPG HWYMPG), MEAN; 22 SAS ESSENTIALS -- Elliott & Woodward
Instead of (CITYMPG HWYMPG), MEAN Redo the COLUMN statement COLUMN BRAND CITYMPG,MEAN HWYMPG,MEAN; Because the COLUMN statement now has CITYMPG and HWYMPG separate for MEAN, the Format assigned for CITYMPG only applies to CITYMPG. 23 SAS ESSENTIALS -- Elliott & Woodward
Add another DEFINE statement for HWYMPG DEFINE HWYMPG/DISPLAY FORMAT=6.1 'Highway MPG'; Now, Because there are two DEFINE statements, one for CITYMPG and one for HWYMPG, both means are formatted as desired 24 SAS ESSENTIALS -- Elliott & Woodward
Change BRAND to CYLINDERS in both the COLUMN and DEFINE statements. Rerun and verify that the report is now grouped by number of CYLINDERS COLUMN CYLINDERS CITYMPG,MEAN HWYMPG,MEAN; DEFINE CYLINDERS/GROUP; A Cylinder= - 1 means a rotary engine. Report now grouped by number of Cylinders 25 SAS ESSENTIALS -- Elliott & Woodward
Add N Option and ORDER=FREQ COLUMN CYLINDERS N CITYMPG,MEAN HWYMPG,MEAN; DEFINE CYLINDERS/GROUP ORDER=FREQ; Now ordered by frequency, and with an N (count) column. 26 SAS ESSENTIALS -- Elliott & Woodward
ANALYSIS OPTION in the DEFINE Statement The DEFINE var/ ANALYSIS option allows you to display a statistic for a specified column. DO HANDS-ON EXAMPLE 20.10 Open the program file AREPORT4.SAS PROCREPORT DATA=MYSASLIB.CARS NOFS; COLUMN BRAND CITYMPG HWYMPG; DEFINE BRAND/GROUP; DEFINE CITYMPG/ANALYSIS MEAN FORMAT=6.1 'CITY/MPG'; RUN; 27 SAS ESSENTIALS -- Elliott & Woodward
Initial Report Results Because of the code DEFINE CITYMPG/ ANALYSIS MEAN FORMAT=6.1 'CITY/MPG'; 1. The CITYMPG MEAN is reported and formatted with 6.1 & 2. HWYMPG is not changed, and the SUM is reported. 28 SAS ESSENTIALS -- Elliott & Woodward
Create a New DEFINE Statement Create a DEFINE statement (with ANALYSIS) that causes the mean HWYMPG to be displayed with a 6.1 format and with an appropriate label. DEFINE HWYMPG/ANALYSIS MEAN FORMAT=6.1 'HWY/MPG'; With HWYMPG also in a DEFINE /ANALYSIS statement, it s mean is also now displayed in 6.1 format 29 SAS ESSENTIALS -- Elliott & Woodward
Include ENGINESIZE (Mean) in the REPORT COLUMN BRAND CITYMPG HWYMPG ENGINESIZE; DEFINE ENGINESIZE/ANALYSIS MEAN FORMAT=6.1 'Engine Size'; ENGINESIZE (mean) now also a column 30 SAS ESSENTIALS -- Elliott & Woodward
Using the COMPUTE Option COMPUTE and ENDCOMP begin and end a segment of SAS code that allows you to calculate values of new variables. DO HANDS-ON EXAMPLE 20.11 Open the program file AREPORT5.SAS PROCREPORT DATA=MYSASLIB.CARS NOFS SPLIT="~"; COLUMN BRAND CITYMPG,MEAN HWYMPG, MEAN RATIO_MPG; DEFINE BRAND/ORDER; DEFINE BRAND/GROUP; DEFINE CITYMPG/DISPLAY FORMAT=6.1 'City MPG'; DEFINE HWYMPG/DISPLAY FORMAT=6.1 'Highway MPG'; DEFINE RATIO_MPG/COMPUTED FORMAT=6.2 'Ratio~CITY/HWY'; COMPUTERATIO_MPG; RATIO_MPG =_C2_/_C3_; ENDCOMP; RUN; Note the 3 places RATIO_MPG is used COMPUTED indicates that the variable RATIO_MPG is NOT in the dataset, but is computed. 31 SAS ESSENTIALS -- Elliott & Woodward
Using the COMPUTE Option COMPUTE and ENDCOMP begin and end a segment of SAS code that allows you to calculate values of new variables. DO HANDS-ON EXAMPLE 20.11 Open the program file AREPORT5.SAS PROCREPORT DATA=MYSASLIB.CARS NOFS SPLIT="~"; COLUMN BRAND CITYMPG,MEAN HWYMPG, MEAN RATIO_MPG; DEFINE BRAND/ORDER; DEFINE BRAND/GROUP; DEFINE CITYMPG/DISPLAY FORMAT=6.1 'City MPG'; DEFINE HWYMPG/DISPLAY FORMAT=6.1 'Highway MPG'; DEFINERATIO_MPG/COMPUTEDFORMAT=6.2 'Ratio~CITY/HWY'; COMPUTE RATIO_MPG; RATIO_MPG =_C2_/_C3_; ENDCOMP; RUN; This code is used to compute RATIO_MPG. Notice the variable named _C2_ and _C3_ refers to the 2nd (CITYMPG) and 3rd (HWYMPG) variables in the DEFINE Statement. Thus, the calculation is actually CITYMPG/HWYMPG 32 SAS ESSENTIALS -- Elliott & Woodward
Some New Statements PROC REPORT DATA=MYSASLIB.CARS NOFS SPLIT="~"; A SPLIT character is defined in the PROC REPORT statement (SPLIT= ~ ) DEFINE RATIO_MPG/ COMPUTEDFORMAT=6.2 'Ratio~CITY/HWY'; COMPUTE RATIO_MPG; RATIO_MPG=_C2_/_C3_; ENDCOMP; Note the split character ~ 33 SAS ESSENTIALS -- Elliott & Woodward
Results from CALCULATED Example The split character ~ in the label Ratio~CITY/HW Y caused the split to occur after the word Ratio Note the results of the calculated value 34 SAS ESSENTIALS -- Elliott & Woodward
SUMMARY of using COMPUTE to create END_RATIO PROCREPORT DATA=MYSASLIB.CARS NOFS SPLIT="~"; COLUMN BRAND CITYMPG,MEAN HWYMPG, MEANENGINESIZE, MEAN RATIO_MPG ENG_RATIO; DEFINE BRAND/ORDER; DEFINE BRAND/GROUP; DEFINE CITYMPG/DISPLAY FORMAT=6.1 'City MPG'; DEFINE HWYMPG/DISPLAY FORMAT=6.1 'Highway MPG'; DEFINE RATIO_MPG/COMPUTED FORMAT=6.2 'Ratio~CITY/HWY'; DEFINE ENG_RATIO/COMPUTED FORMAT=6.2 'Engine~Ratio'; COMPUTE RATIO_MPG; RATIO_MPG=_C2_/_C3_; ENDCOMP; COMPUTE ENG_RATIO; ENG_RATIO=_C2_/_C4_; ENDCOMP; RUN; New CODE required to create the ENG_RATIO column is in RED. 35 SAS ESSENTIALS -- Elliott & Woodward
Results of Adding ENG_RATIO column Note new ENG_RATIO column 36 SAS ESSENTIALS -- Elliott & Woodward
DO HANDS-ON EXERCISE 20.12 Indicates breakdown of variable by categories of SUV Open the program file AREPORT6.SAS PROCFORMAT; VALUE FMTSUV 0="NOT SUV" 1="SUV"; PROCREPORT DATA=MYSASLIB.CARS NOFS; COLUMN BRAND CITYMPG,SUV HWYMPG,SUV; DEFINE BRAND/ORDER; DEFINE BRAND/GROUP; DEFINE CITYMPG/ANALYSIS MEAN FORMAT=6.1; DEFINE HWYMPG/ANALYSIS MEAN FORMAT=6.1; DEFINE SUV/ ACROSS 'BY SUV'; FORMAT SUV FMTSUV.; RUN; DEFINE var/ ACROSS allows you to create a column for each unique item for a categorical variable. 37 SAS ESSENTIALS -- Elliott & Woodward
Results of ACROSS Option DEFINE SUV/ ACROSS 'BY SUV'; FORMAT SUV FMTSUV.; Notice how CITYMPG and HWYMPG are reported in categories NOTSUV and SUV across each main variable.. (i.e., the column is split into categories) Where the FORMAT for SUV was defined in a PROC FORMAT statement 38 SAS ESSENTIALS -- Elliott & Woodward
Create Another Column (ENGINESIZE) Create another column for ENGINESIZE were the sizes are listed across the table by SUV. New code needed: COLUMN BRAND CITYMPG,SUV HWYMPG,SUV ENGINESIZE,SUV; DEFINE ENGINESIZE/ ANALYSIS MEAN FORMAT=6.1 Note new ENGINESIZE column broken down by SUV (across) 39 SAS ESSENTIALS -- Elliott & Woodward
Change all of the SUV references to AUTOMATIC to compare MPG and ENGINESIZE for cars with and without automatic transmissions. New format added PROCFORMAT; VALUE FMTSUV 0="NOT SUV" 1="SUV"; VALUE FMTAUTO 0="Manual" 1="Automatic"; PROCREPORT DATA=MYSASLIB.CARS NOFS; COLUMN BRAND CITYMPG, AUTOMATIC HWYMPG,AUTOMATIC ENGINESIZE,AUTOMATIC; DEFINE BRAND/ORDER; DEFINE BRAND/GROUP; DEFINE CITYMPG/ANALYSIS MEAN FORMAT=6.1; DEFINE HWYMPG/ANALYSIS MEAN FORMAT=6.1; DEFINE ENGINESIZE/ANALYSIS MEAN FORMAT=6.1; DEFINE AUTOMATIC/ ACROSS 'TYPE TRANS'; FORMAT AUTOMATIC FMTAUTO.; RUN; CITYMPG, HWYMPG and ENGINESIZE all broken down y AUTOMATIC Note the ACROSS Statement 40 SAS ESSENTIALS -- Elliott & Woodward
DEFINE AUTOMATIC/ ACROSS TYPE TRANS'; Resulting Report for AUTOMATIC 41 SAS ESSENTIALS -- Elliott & Woodward
ADDITIONAL TECHNIQUES for PROC REPORT There are several other ways you can enhance the output of your report. Reporting Multiple Statistics: In the COLUMN statement, you can request multiple statistics for a variable by placing a request in parenthesis. For example COLUMN BRAND CITYMPG , (N MEAN STD) ; Requests multiple statistics 42 SAS ESSENTIALS -- Elliott & Woodward
DO HANDS-ON EXAMPLE 20.13 Open program file AREPORT7.SAS PROCREPORT DATA=MYSASLIB.CARS NOFS; COLUMN BRAND CITYMPG,(N MEAN STD) HWYMPG ENGINESIZE ; DEFINE BRAND/GROUP; DEFINE CITYMPG/ FORMAT=6.1 'City MPG'; DEFINE N / 'N' format=4.; DEFINE HWYMPG/ ANALYSIS MEAN FORMAT=6.1; DEFINE ENGINESIZE/ ANALYSIS MEAN FORMAT=6.1; RUN; Note statistics requested 43 SAS ESSENTIALS -- Elliott & Woodward
Initial Output from PROC REPORT Note multiple statistics in the City MPG column because of the entry CITYMPG,(N MEAN STD) In the COLUMN statement 44 SAS ESSENTIALS -- Elliott & Woodward
Create similar columns for HWYMPG and ENGINESIZE Change the COLUMN statement to COLUMN BRAND CITYMPG,(N MEAN STD) HWYMPG,(N MEAN STD) ENGINESIZE,(N MEAN STD); 45 SAS ESSENTIALS -- Elliott & Woodward
Reporting Totals and Subtotals in PROC REPORT To display totals at the bottom of a column of numbers, use the BREAK and RBREAK statements. BREAK produces a summary at a specified break RBREAK specifies a summary at the beginning or end of a report. A simplified BREAK statement syntax is: BREAK <BEFORE|AFTER> var/SUMMARIZE <SUPPRESS>; For the RBREAK statement, the syntax is RBREAK < BEFORE|AFTER >/SUMMARIZE; 46 SAS ESSENTIALS -- Elliott & Woodward
DO HANDS-ON EXAMPLE 20.15 Open the program file AREPORT8.SAS PROC REPORT DATA=MYSASLIB.CARS NOFS; COLUMN BRAND CYLINDERS AUTOMATIC SUV; DEFINE BRAND/GROUP; DEFINE CYLINDERS/GROUP; BREAK AFTER BRAND/SUMMARIZE SUPPRESS; RBREAK AFTER/ SUMMARIZE ; WHERE CYLINDERS NE -1 ; RUN; Note BREAK AFTER and RBREAK AFTER 47 SAS ESSENTIALS -- Elliott & Woodward
BREAK and RBREAK Output BREAK is used to count the number of cars that are automatic or are SUV s RBREAK creates a grand total. 48 SAS ESSENTIALS -- Elliott & Woodward
Output Without Suppress To see what the SUPPRESS option does in the BREAK statement, delete SUPRESS and rerun the code Notice duplicated names at subtotal because not Notice duplicated names at subtotal because not suppressed. suppressed. 49 SAS ESSENTIALS -- Elliott & Woodward
20.2.1 Writing Reports Within a Data Statement Another way to create reports in a SAS dataset is using the PUT statement: 1. Specify the name _NULL_ as the dataset name in a DATA step to use the features of the DATA step without creating a SAS dataset as output. 2. Define a destination (output file) for the report using a FILE statement. The statement FILE PRINT sends the report output to the SAS Results Viewer. When you use FILE "file-specification," the report output is sent to the specified text file location. 3. Use PUT statements within the DATA step to create lines of output for the report. 50 SAS ESSENTIALS -- Elliott & Woodward


")


")


 in the REPORT")


")