Creating Gantt Chart Schedules: A Comprehensive Guide
Explore the history and evolution of Gantt charts, learn how to create various types of Gantt charts, including bar charts, and understand the step-by-step process of creating a Gantt chart schedule manually. Dive into the world of project management with this detailed tutorial.

Download Presentation

Please find below an Image/Link to download the presentation.
The content on the website is provided AS IS for your information and personal use only. It may not be sold, licensed, or shared on other websites without obtaining consent from the author. If you encounter any issues during the download, it is possible that the publisher has removed the file from their server.
You are allowed to download the files provided on this website for personal or commercial use, subject to the condition that they are used lawfully. All files are the property of their respective owners.
The content on the website is provided AS IS for your information and personal use only. It may not be sold, licensed, or shared on other websites without obtaining consent from the author.
E N D
Presentation Transcript
Module Learning Objectives History of Gantt Chart Schedule How to create a Gantt Chart Types of Gantt Charts How to Create a Gantt Chart using Microsoft Excel
Gantt (Bar) Chart Schedule History The development of the bar chart dates back to World War I, when Henry L. Gantt used the bar chart method of scheduling to plan and control military operations. In honor of Gantt s early development of bar chart scheduling, you will often hear the term Gantt chart when referring to a bar chart. For practical purposes, the terms Gantt chart, Gantt schedule, or bar chart schedule are one and the same.
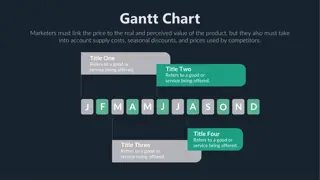
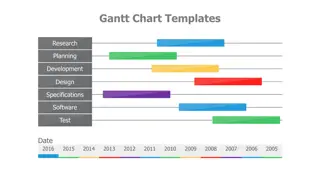
Gantt (Bar) Chart Schedule Definition A bar chart is a graphic representation of project activities, shown in a time- scaled bar line
Gantt (Bar) Chart Schedule Creating Bar Charts The creation of a hand-drawn bar chart schedule is a relatively simple process Step 1: Using a piece of graph paper, write the calendar date across the top of the page. Some managers like to list the work day as well. The time scale is typically based on units of days, but for a summary bar chart or long- range planning (when less detail is necessary) it is common to use units of weeks, months, quarters, or even years
Gantt (Bar) Chart Schedule Creating Bar Charts Step 2: list the activities required to complete the project on the left side of the paper. As the activities are listed, put them in chronological order. Step 3: Determine the durations of activities. The duration should be based on productivity records, available resources, and experience. We will learn how to determine duration of activities in more detail later in this course
Gantt (Bar) Chart Schedule Creating Bar Charts Step 4: show or plot a bar on the dates when that activity is expected to take place. Commonly bars are shaded. For example, This beginning bar chart shows Survey as the first activity, which is scheduled to take place on the first work day, July 1. Continue listing the activities in chronological order with their corresponding bars as shown in the Figure. Read page 28-29 from handout Bar Chart Schedules
Gantt (Bar) Chart Schedule Creating Bar Charts Example Your project manager asks you to buy a piece of equipment for a project. Develop a Gantt chart for this activity. Start day Sep 12th Calendar Day 09/12 09/13 09/14 09/15 09/16 09/17 09/18 09/19 09/20 09/21 Activity Description Dur 1 2 3 4 5 W W 6 7 8 Determine equipment requirements 1 Determine budget 1 Research Brands and Models and Select 3 Check On-line and local outlets 2 Select Retailer and Purchase 1
Gantt (Bar) Chart Schedule Creating Bar Charts Class Exercise You are the head of engineering of a company. Recently a quality control engineer is retired and you need to hire a new quality control engineer to replace the position. Develop a Gantt chart for this hiring project with at least 8 tasks/activities. Project start second Monday of June.
Gantt (Bar) Chart Schedule Creating Bar Charts 0
Gantt (Bar) Chart Schedule Advantages of Bar Charts Simple and ease of prepare and understand Bar charts are time-scaled. Just by looking at the chart one can get an idea on the duration of each activity. Bar charts particularly appeal to persons who do not have a technical background.
Gantt (Bar) Chart Schedule What are the disadvantages of Bar Charts The main disadvantage of bar charts is lack of logical representation (relationships): Why did this activity start on that date? Bar charts do not reveal the answer. It could be a logical relationship, a resource constraint, or a subjective decision by the project manager/scheduler/owner Not easily modified Bar charts may not be practical for complex projects with large numbers of activities 0
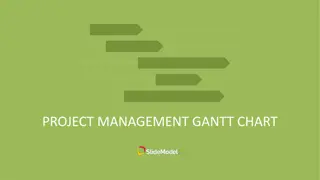
Gantt (Bar) Chart Schedule Various Types of Bar Charts Bar charts have become a vehicle for representing many pieces of a project s information. Many variations of bar charts have evolved Bar chart loaded with construction labor hours
Gantt (Bar) Chart Schedule Various Types of Bar Charts Bar charts have become a vehicle for representing many pieces of a project s information. Many variations of bar charts have evolved Bar chart loaded with construction budget
Gantt (Bar) Chart Schedule Various Types of Bar Charts Bar charts have become a vehicle for representing many pieces of a project s information. Many variations of bar charts have evolved Bar chart shows comparison between as planned vs as built
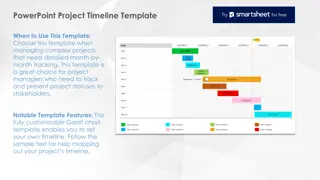
How to Create a Gantt Chart using Microsoft Excel Click on the link below to learn how to create an automated Gantt (bar) chart in Microsoft Excel https://www.youtube.com/watch?v=6MOw3qDG4iI


 Chart Schedule")
 Chart Schedule")
 Chart Schedule")
 Chart Schedule")
 Chart Schedule")
 Chart Schedule")
 Chart Schedule")
 Chart Schedule")
 Chart Schedule")
 Chart Schedule")
 Chart Schedule")
 Chart Schedule")
 Chart Schedule")
 Chart Schedule")