Discover how the City of Detroit is transforming homeless services by setting objective, measurable outcomes. Learn about breaking down HUD System Performance Measures, establishing community baselines, and incorporating outcomes into funding decisions.
Please find below an Image/Link to download the presentation.
The content on the website is provided AS IS for your information and personal use only. It may not be sold, licensed, or shared on other websites without obtaining consent from the author. If you encounter any issues during the download, it is possible that the publisher has removed the file from their server.
You are allowed to download the files provided on this website for personal or commercial use, subject to the condition that they are used lawfully. All files are the property of their respective owners.
The content on the website is provided AS IS for your information and personal use only. It may not be sold, licensed, or shared on other websites without obtaining consent from the author.
E N D
Presentation Transcript
FROM OUTPUTS TO OUTCOMES: CREATING OBJECTIVE, MEASURABLE OUTCOMES TO IMPROVE SERVICES PROVIDED IN HOMELESS PROGRAMS Meghan Takashima, Homelessness Solutions Manager, City of Detroit Terra Linzner, Program Analyst, City of Detroit
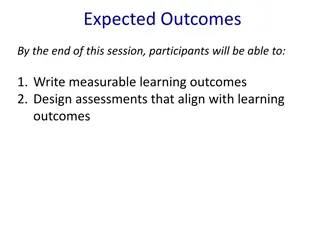
Goals of this Session 1. Learn how to breakdown HUD System Performance Measures into program level performance goals 2. Establish community baselines using HMIS data 3. Incorporate performance measures and outcomes into funding decisions
Overview City of Detroit s past role in the CoC and participation in ending homelessness Challenges related to spending our HUD entitlement grants in a timely manner Redefining expectations
Why Change? HUD Expectations clearly outlined in audit findings Inadequate guidance or oversight of subrecipients was precarious for COD Needs of those experiencing homelessness weren t coming first A move toward systems thinking, particularly in the role of shelter and street outreach
Post Clean-Up Priority: Creating Policies and Procedures Establishing and rolling out clear, defined expectations including such riveting topics as: Billing Service Provision fair housing act, refining HUD allowability for local needs Data Collection with purpose
Redefining Performance Using the an RFP Process The 2019-2020 application helped sent the tone for the new data driven format Work was done with the Mayor s Office and City Council in advance to help them understand the direction we were going Notable differences: Presenting the direction forward over the course of years A focus on improving integration with the system and seeing how sectors are interconnected Increasing the number of quantitative metrics Reducing the number of subjective essay questions
Homelessness Solutions Priorities Improve the quality of services Help people quickly regain stability through permanent housing Enhance alignment of ESG regulations with other HUD programs (including CDBG, HOME, and the Housing Choice Voucher (HCV) program) Support more coordinated and effective data collection, performance measurement, and program evaluation
Why Focus on Performance? Since 2015, 32% reduction in the number of households experiencing homelessness* Program performance metrics feed our system performance and ranking against other communities Data provides one basis for objective, transparent, and fair decision-making
Definitions Performance Measure: Regular measurement of outcomes to review effectiveness of programs. Performance Baseline: Expected level of performance against which all subsequent levels of performance are compared. Performance Benchmark: Expected performance that a subrecipient must meet or exceed.
Performance Measures City based Performance Measures on local and federal expectations Path of least resistant Determined what measures we could realistically gather data on HMIS reports vs. remote client file review
Performance Measures Changed our minds again and again based on what data was realistic to pull on a regular basis for both the City and agencies Example: % of Clients who exit to PH within 180 days Changed to: % of Clients that exit to PH and % of Clients who exit within 180 days Both of these new measures are easy to pull from the CoC APR
Methodology HAND (HMIS Lead) generated 2018 calendar year data Ran reports after the PIT when data would be cleaner Ran CoC APR for all programs in the CoC, regardless of funding type: Outreach Emergency Shelters Warming Centers Rapid Re-Housing Prevention
Methodology Performance Baselines calculated with the same method applicants are required to use in the RFP Baseline was increased by approximately 10% to establish the Performance Benchmarks
Outreach Measures, Baseline, and Benchmarks Source of Baseline Data Performance Benchmark 2018 Baseline Performance Measures Street Outreach Percent of clients that meet the definition of unsheltered homelessness 100% per HUD regulatory requirements N/A 100% Percent of clients who complete all CAM required assessments N/A- Will be determined in the 2019 calendar year N/A N/A CoC APR for all Outreach Programs Percent of clients who exit to any sheltered destination 64% 70% Navigation Percent of clients that meet the definition of unsheltered homelessness 100% per HUD regulatory requirements N/A- Will be determined in the 2019 calendar year N/A 100% N/A N/A Percent of clients who become document ready N/A- First time the City is funding Navigation, therefore a benchmark will be established in the following year Percent of clients who exit to a permanent housing destination N/A N/A
ES Measures, Baseline, and Benchmarks Source of Baseline Data Performance Benchmark 2018 Baseline Performance Measures Emergency Shelter N/A- Performance expectation outlined in the City of Detroit Policy and Procedures Manual Shelter utilization rate according to data reported on CoC APR N/A 90% CoC APR for all Family Shelters Family: 66% 70% Percentage of exits to a permanent housing destination CoC APR for all Single Shelters Singles: 15% Singles: 18% CoC APR for all Youth Shelters Youth: 42% Youth: 45% N/A- Benchmark will be established in the 2019 calendar year Percentage of client charts that demonstrate a housing plan within 14 days of entry N/A N/A
Emergency Shelter Categories Name Cass Community Social Services Type Emergency Shelter Project Family Shelter Shelter Type Family Coalition on Temporary Shelter (COTS) Emergency Shelter Shelter Family Detroit Rescue Mission Ministries Emergency Shelter Genesis House III Family Detroit Rescue Mission Ministries Emergency Shelter DRMM - Detroit CoC - Emergency Shelter - Genesis House Two Family The Salvation Army Emergency Shelter Salvation Army - Detroit CoC - New Booth Shelter Family YWCA Emergency Shelter Interim House Family Detroit Rescue Mission Ministries Emergency Shelter Oasis Singles Love Outreach Emergency Shelter Love Outreach Singles Mariner's Inn Emergency Shelter Emergency Shelter Singles Michigan Veteran's Foundation Emergency Shelter Vet Rescue Singles Neighborhood Service Organization (NSO) Emergency Shelter Tumaini Center Singles Operation Get Down Emergency Shelter Emergency Shelter Singles Samaritas Emergency Shelter Heartline Singles St. John's Community Center Emergency Shelter St. John's Community Center (ES) Singles St. John's Community Center Emergency Shelter Haven House Singles Freedom House Emergency Shelter Singles Cass Community Social Services Emergency Shelter Rotating Shelter Singles Detroit Rescue Mission Ministries Emergency Shelter DRM Singles Alternatives for Girls Emergency Shelter Residential 21 ESG Youth Alternatives for Girls Emergency Shelter Basic Center Shelter S Youth Covenant House Michigan Emergency Shelter Caritas Youth CCSWC Emergency Shelter Youth Cass Community Social Services Warming Center Warming Center Family Detroit Rescue Mission Ministries Warming Center 1. Warming Center - G3 (10852) Family Detroit Rescue Mission Ministries Warming Center DRM Warming Center Singles
Warming Center Measures, Baseline, and Benchmarks Source of Baseline Data Performance Benchmark 2018 Baseline Performance Measures Warming Center Shelter utilization rate according to data reported on CoC APR 90% N/A 90% Percentage of exits to a permanent housing destination CoC APR for all Warming Centers 11% 13% N/A- Benchmark will be established in the 2019 calendar year Percentage of client charts that demonstrate a housing plan within 14 days of entry N/A N/A
RRH Measures, Baseline, and Benchmarks Source of Baseline Data Performance Benchmark 2018 Baseline Performance Measures Rapid Re-Housing CoC APR for all Rapid-Rehousing programs Average length of time to move clients into housing from program entry 83 days 75 days N/A- Benchmark will be established in the 2019 calendar year N/A- Benchmark will be established in the 2019 calendar year Percent of clients that receive case management services at least every 30 days N/A N/A Percent of clients that receive home visits at least once every 90 days N/A N/A CoC APR for all Rapid-Rehousing programs Percent of clients who exit to a permanent housing destination 94% 94% CoC APR for all Rapid-Rehousing programs Percent of clients who exit within 180 days of program entry 59% 65%
Prevention Measures, Baseline, and Benchmarks Source of Baseline Data Performance Benchmark 2018 Baseline Performance Measures Prevention CoC APR for all Prevention programs CoC APR for all Prevention programs Percent of clients in the program for three months or less 79% 85% Percent of clients who exit to a permanent housing destination 99% 99% N/A- Benchmark will be established in the 2019 calendar year Percent of clients that remain housed within one year of program exit N/A N/A
Methodology Created an excel doc that can automatically generated performance based on the CoC APR ..\RFP\20'21 docs\Form 5_Outcome Calculation Workbook_20'21.xlsx Hosted two sub recipient workshops explaining process after the RFP was released
Performance Measures Grids EMERGENCY SHELTER PERFORMANCE MEASURES PERFORMANCE BENCHMARKS 2018 CALENDAR YEAR PROGRAM PERFORMANCE DID THE PROGRAM PERFORMANCE MEET OR EXCEED THE BENCHMARK? (Y/N) #1- Shelter utilization rate according to data reported on CoC APR 90% Utilization Family Shelters: 70% Family Shelters: ___ Family Shelters: ___ #2- Percentage of exits to a permanent housing destination Single Shelters: 18% Single Shelters: ___ Single Shelters: ___ Youth Shelters: 45% Youth Shelters: ___ Youth Shelters: ___ N/A- Benchmark will be established in the 2019 calendar year #3- Percentage of client charts that demonstrate a housing plan within 14 days of entry N/A N/A For each measures that did not meet the required benchmark, describe what changes you will make to ensure that your program will meet the required Performance Benchmarks in the 19-20 grant year:
Implementation Year 3 (21 22) Year 2 (20 21) 1. Agencies generate outcomes 2. Action Plan to improve performance 3. City publishes benchmarks for measures that require file audits 4. Jan-June 2020 HMIS data used for 2020-21 RFP 5. Failure to meet benchmarks will reduce grant application score, but may not directly decrease funding Year 1 (19 20) 1. Agencies generate outcomes 2. Action Plan to improve performance 1. Agencies generate outcomes 2. City evaluates agencies on performance using 2020 calendar year data 3. Unmet benchmarks will significantly impact funding
Moving Forward Review Baselines based on 2019 calendar year data Determine missing baselines Quarterly remote HMIS file reviews starting in 2020 Publish new baselines and benchmarks along with methodology Offer TA to agencies that are not meeting benchmarks
Lessons Learned Lead with data Slow roll out is best Coordination with the HMIS Lead is essential Sometimes measures may need to change depending on how well you can pull (or trust) the data Some areas of our system were doing better or worse than we originally expected Requiring agencies to calculate outcomes sparked internal changes to better streamline their processes