Creating Value Stream Maps for Process Optimization
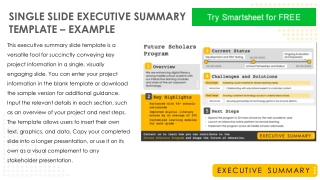
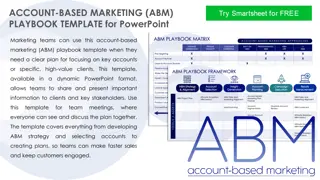
Utilize the provided Basic Value Stream Map template and icons to design your own process maps effectively. Understand the process steps, total lead time, cycle time, bottlenecks, and recommendations. Learn by example with detailed process steps, lead time reductions, and resource utilization. Explore how to tackle delays through automation and enhance workflow efficiency.

Download Presentation

Please find below an Image/Link to download the presentation.
The content on the website is provided AS IS for your information and personal use only. It may not be sold, licensed, or shared on other websites without obtaining consent from the author. If you encounter any issues during the download, it is possible that the publisher has removed the file from their server.
You are allowed to download the files provided on this website for personal or commercial use, subject to the condition that they are used lawfully. All files are the property of their respective owners.
The content on the website is provided AS IS for your information and personal use only. It may not be sold, licensed, or shared on other websites without obtaining consent from the author.
E N D
Presentation Transcript
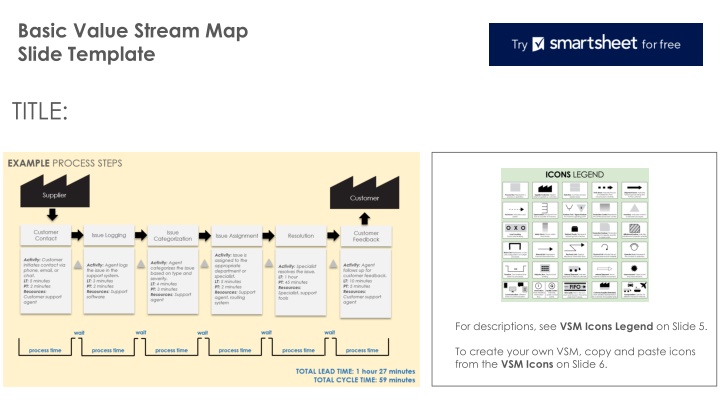
Basic Value Stream Map Slide Template TITLE: For descriptions, see VSM Icons Legend on Slide 5. To create your own VSM, copy and paste icons from the VSM Icons on Slide 6.
PROCESS STEPS To create your own VSM, copy and paste icons from the VSM Icons on Slide 6. TOTAL LEAD TIME: 0 hours 00 minutes TOTAL CYCLE TIME: 0 hours 00 minutes
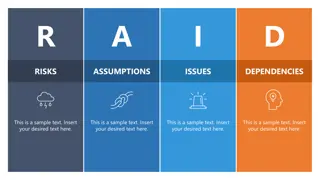
NOTES Bottlenecks: Description ... Recommendations: Description ...
EXAMPLE PROCESS STEPS Supplier Customer Customer Contact Issue Customer Feedback Issue Logging Issue Assignment Resolution Categorization Activity: Issue is assigned to the appropriate department or specialist. LT: 5 minutes PT: 2 minutes Resources: Support agent, routing system Activity: Customer initiates contact via phone, email, or chat. LT: 5 minutes PT: 2 minutes Resources: Customer support agent Activity: Agent categorizes the issue based on type and severity. LT: 4 minutes PT: 3 minutes Resources: Support agent Activity: Agent follows up for customer feedback. LT: 10 minutes PT: 5 minutes Resources: Customer support agent Activity: Agent logs the issue in the support system. LT: 3 minutes PT: 2 minutes Resources: Support software Activity: Specialist resolves the issue. LT: 1 hour PT: 45 minutes Resources: Specialist, support tools wait wait wait wait wait process time process time process time process time process time process time NOTES Bottlenecks: Issue assignment and resolution stages often face delays. TOTAL LEAD TIME: 1 hour 27 minutes TOTAL CYCLE TIME: 59 minutes Recommendations: Implement automated issue categorization and assignment to reduce lead times.
Copy and paste the icons below to create your own VSM.
DISCLAIMER Any articles, templates, or information provided by Smartsheet on the website are for reference only. While we strive to keep the information up to date and correct, we make no representations or warranties of any kind, express or implied, about the completeness, accuracy, reliability, suitability, or availability with respect to the website or the information, articles, templates, or related graphics contained on the website. Any reliance you place on such information is therefore strictly at your own risk.