Crime Rates, Pandemic, and Social Unrest Study Update
Weekly crime changes in 34 cities from January 2018 to September 2021 show a sharp rise in homicides in 2020, with property and drug crime rates falling. Policy suggestions include implementing anti-violence strategies and improving police-community relations. The study compares violent crimes, property crimes, and drug offenses from the third quarter of 2020 to the third quarter of 2021, highlighting variations in different crime categories.

Download Presentation

Please find below an Image/Link to download the presentation.
The content on the website is provided AS IS for your information and personal use only. It may not be sold, licensed, or shared on other websites without obtaining consent from the author.If you encounter any issues during the download, it is possible that the publisher has removed the file from their server.
You are allowed to download the files provided on this website for personal or commercial use, subject to the condition that they are used lawfully. All files are the property of their respective owners.
The content on the website is provided AS IS for your information and personal use only. It may not be sold, licensed, or shared on other websites without obtaining consent from the author.
E N D
Presentation Transcript
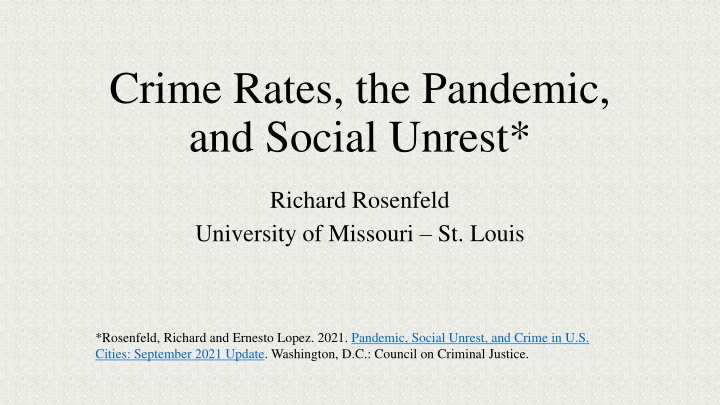
Crime Rates, the Pandemic, and Social Unrest* Richard Rosenfeld University of Missouri St. Louis *Rosenfeld, Richard and Ernesto Lopez. 2021. Pandemic, Social Unrest, and Crime in U.S. Cities: September 2021 Update. Washington, D.C.: Council on Criminal Justice.
Summary Weekly crime changes for ten different offenses in 34 cities, January 2018 September 2021 Homicides rose sharply in 2020 Up in 29 of 34 cities ~30% higher on average than in 2019 1,268 more deaths in the 34 cities than the year before Homicide increase slows in 2021 2020 homicide increase did not erase long term drop 16 deaths per 100,000 residents (annualized) in 2021 28 per 100,000 in 1995
Summary, cont. Property and drug crime rates continued to fall Explanations Policy challenge Implement proven anti-violence strategies Improve police-community relations Issue timely crime statistics
Third Quarter 2020 to Third Quarter 2021 Violent Crimes Homicide +4% Aggravated Assault +3% Gun Assault +.4% Domestic Violence +.06% Robbery -6% Property Crimes and Drug Offenses Residential Burglary -10% Nonresidential Burglary -11% Larceny -5% Motor Vehicle Theft +13% Drug Offenses -14%
Figure 1. Average Weekly Homicide Rate in 22 Cities, January 2018 - September 2021 0.8 Pandemic 0.7 Homicides per 100,000 Population 0.6 Prior Peak 0.5 0.4 0.3 0.2 0.1 0 Jan' 18 Mar' 18 Jun' 18 Sep' 18 Jan' 19 Mar' 19 Jun' 19 Sep' 19 Jan' 20 Mar' 20 Jun' 20 Sep' 20 Jan' 21 Mar' 21 Jun' 21 Sep' 21
Figure 3. Average Weekly Aggravated Assault Rate in 17 Cities, January 2018 - September 2021 14 Pandemic 12 Aggravated Assaults per 100,000 Population Prior Peak 10 8 6 4 2 0 Jan' 18 Mar' 18 Jun' 18 Sep' 18 Jan' 19 Mar' 19 Jun' 19 Sep' 19 Jan' 20 Mar' 20 Jun' 20 Sep' 20 Jan' 21 Mar' 21 Jun' 21 Sep' 21
Figure 4. Average Weekly Gun Assault Rate in 13 Cities, January 2018 - September 2021 9 Pandemic 8 Prior Peak Gun Assaults per 100,000 Population 7 6 5 4 3 2 1 0 Jan' 18 Mar' 18 Jun' 18 Sep' 18 Jan' 19 Mar' 19 Jun' 19 Sep' 19 Jan' 20 Mar' 20 Jun' 20 Sep' 20 Jan' 21 Mar' 21 Jun' 21 Sep' 21
Figure 5. Average Weekly Domestic Violence Rate in 13 Cities, January 2018 - September 2021 25 Pandemic Domestic Violence Incidents per 100,000 Population Prior Peak 20 15 10 5 0 Jan' 18 Mar' 18 Jun' 18 Sep' 18 Jan' 19 Mar' 19 Jun' 19 Sep' 19 Jan' 20 Mar' 20 Jun' 20 Sep' 20 Jan' 21 Mar' 21 Jun' 21 Sep' 21
Figure 6. Average Weekly Robbery Rate in 24 Cities, January 2018 - September 2021 7 Pandemic Prior Peak 6 Robberies per 100,000 Population 5 4 3 2 1 0 Jan' 18 Mar' 18 Jun' 18 Sep' 18 Jan' 19 Mar' 19 Jun' 19 Sep' 19 Jan' 20 Mar' 20 Jun' 20 Sep' 20 Jan' 21 Mar' 21 Jun' 21 Sep' 21
Figure 7. Average Weekly Residential Burglary Rate in 16 Cities, January 2018 - September 2021 9 Pandemic Prior Peak 8 Residential Burglaries per 100,000 Population 7 6 5 4 3 2 1 0 Jan' 18 Mar' 18 Jun' 18 Sep' 18 Jan' 19 Mar' 19 Jun' 19 Sep' 19 Jan' 20 Mar' 20 Jun' 20 Sep' 20 Jan' 21 Mar' 21 Jun' 21 Sep' 21
Figure 8. Average Weekly Non-Residential Burglary Rate in 16 Cities, January 2018 - September 2021 40 Pandemic Non-Residential Burglaries per 100,000 Population 35 30 25 20 Prior Peak 15 10 5 0 Jan' 18 Mar' 18 Jun' 18 Sep' 18 Jan' 19 Mar' 19 Jun' 19 Sep' 19 Jan' 20 Mar' 20 Jun' 20 Sep' 20 Jan' 21 Mar' 21 Jun' 21 Sep' 21
Figure 10. Average Weekly Motor Vehicle Theft Rate in 24 Cities, January 2018 - September 2021 18 Pandemic 16 Motor Vehicle Thefts per 100,000 Population 14 Prior Peak 12 10 8 6 4 2 0 Jan' 18 Mar' 18 Jun' 18 Sep' 18 Jan' 19 Mar' 19 Jun' 19 Sep' 19 Jan' 20 Mar' 20 Jun' 20 Sep' 20 Jan' 21 Mar' 21 Jun' 21 Sep' 21
Figure 11. Average Weekly Drug Offense Rate in 17 Cities, January 2018 - September 2021 16 Pandemic Prior Peak 14 Drug Offenses per 100,000 Population 12 10 8 6 4 2 0 Jan' 18 Mar' 18 Jun' 18 Sep' 18 Jan' 19 Mar' 19 Jun' 19 Sep' 19 Jan' 20 Mar' 20 Jun' 20 Sep' 20 Jan' 21 Mar' 21 Jun' 21 Sep' 21
Where is the Violence Increase Occurring? Communities The increase is concentrated in communities with chronically high levels of firearm violence tied to racial disparity, segregation, poverty, under-employment Population Groups The increase is concentrated among young men who live in these communities Little evidence that firearm violence is spreading to other areas or groups
Six Explanations Neither Exhaustive Nor Mutually Exclusive 1. Change in Routine Activities 2. De-Policing 3. De-Legitimizing 4. More Guns 5. More Drugs 6. More Stress
Change in Routine Activities Figure 11. Average Monthly COVID Death Rate, Unemployment Rate, and Residential Duration, 2020 (N=31) 25 80 Deaths per 100,000 Population 70 Residential Duration (%) 20 60 Unemployment Rate 50 15 40 10 30 20 5 10 0 0 Feb Mar Apr May Jun Jul Aug Sep Oct Nov Dec
De-Policing Very strong assumption about the impact of policing on homicide Burglary and larceny rates dropped; motor vehicle theft up 13% Claim is largely anecdotal, based on survey data without a baseline, or results are cherrypicked (see http://www.policedefense.org/wp- content/uploads/2021/04/Depolicing_April14.pdf). Study of 50 large cities found no effect of declining arrests on homicide after Ferguson (Rosenfeld and Wallman 2019)
Police Legitimacy Police legitimacy linked to confidence in and cooperation with police (Mazerolle, Bennett, Davis, et al. 2013) Racial gap in confidence has widened Ferguson Minneapolis Source: https://news.gallup.com/poll/317114/black-white-adults-confidence- diverges-police.aspx
Recommendations Stemming the recent increase in gun violence Police reform Increase accountability for misconduct Redirect certain activities to other agencies (https://theappeal.org/the-lab/polling-memos/likely-voters- support-non-police-emergency-response/) Services and support for those at high risk (Group Violence Reduction Strategy) Redouble proactive and protective policing FBI should continue issuing quarterly UCR-NIBRS data
Will Rising Inflation Increase Crime?* *Rosenfeld & Levin (2016); Rosenfeld & Vogel (2021).
References and Further Information Braga, A.A., Turchan, B.S., Papachristos, A.V., & Hureau, D. M. (2019). Hot spots policing and crime reduction: an update of an ongoing systematic review and meta-analysis. Journal of Experimental Criminology, 15, 289 311. https://doi.org/10.1007/s11292-019-09372-3. Cohen, L. E., & Felson, M. (1979). Social change and crime rate trends: A routine activity approach. American Sociological Review, 44(4), 588-608. Eisner, M., & Nivette, A. (2020). Violence and the Pandemic: Urgent Questions for Research. New York: Harry Frank Guggenheim Foundation. Evans, M., Lindauer, M., & Farrell, M. (2020). A pandemic within a pandemic--intimate partner violence during COVID-19. New England Journal of Medicine 383, 2302-2304. Lopez, E., & Rosenfeld, R. (2021). Crime, quarantine, and the U.S. coronavirus pandemic. Criminology & Public Policy https://doi.org/10.1111/1745-9133.12557. Lum, C., Maupin, C., & Stoltz, M. (2020). The Impact of COVID-19 on Law Enforcement Agencies (Wave 2). Washington, DC: International Association of Chiefs of Police and George Mason University. https://www.theiacp.org/sites/default/files/IACP_Covid_Impact_Wave2.pdf.
References and Further Information, cont. Mazerolle, L., Bennett, S., Davis, J., Sargeant, E., & Manning, M. (2013). Procedural justice and police legitimacy: a systematic review of the research evidence. Journal of Experimental Criminology, 9, 245 274. Piquero, A. R., Jennings, W. G., Jemison, E., Kaukinen, C., & Knaul, F. M. (2021). Evidence from a systematic review and meta- analysis: Domestic violence during the COVID-19 Pandemic. Journal of Criminal Justice, 101806. https://doi.org/10.1016/j.jcrimjus.2021.101806. Rosenfeld, R., & Levin, A. (2016). Acquisitive crime and inflation in the United States: 1960 - 2012. Journal of Quantitative Criminology,32, 427-447. Rosenfeld, R., & Vogel, M. (2021). Homicide, acquisitive crime, and inflation: A city-level longitudinal analysis. Crime & Delinquency https://doi.org/10.1177/00111287211039994. Rosenfeld, R., & Wallman, J. (2019). Did de-policing cause the homicide rise? Criminology & Public Policy,18, 51-75. Rosenfeld, R., Abt, T., & Lopez, E. (2021). Pandemic, Social Unrest, and Crime in U.S. Cities: 2020 Year-End Update. Washington, D.C.: Council on Criminal Justice. Stickle, B., & Felson, M. (2020). Crime rates in a pandemic: The largest criminological experiment in history. American Journal of Criminal Justice, 45(4), 525-536.