Cross-Cultural Research: Measurement and Sampling Insights
Explore the intricacies of measurement and sampling in cross-cultural research, including the importance of validity, reliability, and common sampling principles for worldwide comparisons. Understand the significance of operationalization and hypothesis testing derived from theory against ethnographic records.

Download Presentation

Please find below an Image/Link to download the presentation.
The content on the website is provided AS IS for your information and personal use only. It may not be sold, licensed, or shared on other websites without obtaining consent from the author. If you encounter any issues during the download, it is possible that the publisher has removed the file from their server.
You are allowed to download the files provided on this website for personal or commercial use, subject to the condition that they are used lawfully. All files are the property of their respective owners.
The content on the website is provided AS IS for your information and personal use only. It may not be sold, licensed, or shared on other websites without obtaining consent from the author.
E N D
Presentation Transcript
CROSS-CULTURAL RESEARCH CAROL R. EMBER AND FRAN BARONE PART III: MEASUREMENT AND SAMPLING FOR WORLDWIDE CROSS-CULTURAL COMPARISONS Prepared for the workshop Cross Cultural Research held at the Institute for Social Science Research (ISSR), October 25-27, 2022
PART II: MEASUREMENT AND SAMPLING FOR WORLDWIDE CROSS-CULTURAL COMPARISONS This presentation will cover Measurement What it means to measure The need for validity and reliability Types of measurement Operationalization Types of error Sources of measurement error and how to minimize it Sampling Important sampling principles Commonly-used samples in worldwide cross-cultural research
MEASUREMENT: how something compares with something else regarding a particular trait or dimension What does it mean?
We measure so that we can test hypotheses derived from theory against the ethnographic record. WHY MEASURE? Measuring always includes operationalization, that is, specifying all the steps needed to move from the meaning of a theoretical construct to the operational measure of that construct.
A simple statement of a relationship between two variables that ought to be found if a theory is true. HYPOTHESIS X Y
TYPES OF MEASUREMENT: NOMINAL ORDINAL INTERVAL RATIO
NOMINAL AND ORDINAL MEASUREMENT Nominal measurement Ordinal measurement Degree of stratification Subset A C 3 Fully stratified highest Gender: A=female B=male C=other A B 2 Partially stratified middle 1 Egalitarian lowest
INTERVAL AND RATIO MEASUREMENT Interval--equal intervals (e.g., average temperature on the Fahrenheit scale) Ratio--equal intervals and a true zero point (population or community size) 68 0 67 1 66 2 65 3 . . . . . .
WHAT MAKES A GOOD MEASURE? All measures are indirect but this does not mean that all measures are equally good In measuring one should strive for Validity Reliability And, if practical, precision
Theoretical construct measure (a) VALIDITY A valid measure taps what it purports to measure measure (b) Theoretical construct
ANOTHER WAY OF THINKING ABOUT VALIDITY M = T + e M=measure T=true score or theoretical score e=error We want e as low as possible
RELIABILITY: Agreement between coders Agreement between ethnographers Consistency, replicability, or stability
While precision is desirable because more precise scores allow the use of more powerful statistics, striving for precision may make it harder for coders to make decisions if the ethnographic data do not often contain precise information. PRECISION Degree of exactness
THE PROCESS OF MEASURING--OPERATIONALIZATION T M Operationalization (analogous to giving a recipe with steps clearly spelled out) Theoretical construct Measure(s) or operational construct(s)
M = T + e (1) Random error (2) Systematic error (biased) Departure from theoretical variable Other systematic bias Two Main Types of Error
PROPERTIES OF MAIN TYPE OF ERROR Systematic Random Means that the errors from the true score tend to be in one direction (positive OR negative) Errors can stem from Ethnographer bias Informant bias Coder bias May also generally deflate correlations, but one possible scenario could be problematic--double systematic error in the same direction could potentially result in a false positive result. Means that the errors from the true score are because of chance departures The sum of the errors (some positive departures; some negative departures) will sum to zero. Generally, the more random error, the more correlations will be deflated from their true value
MEASUREMENT ERROR AND HOW TO MINIMIZE IT
ERRORS IN MEASUREMENT CAN ARISE FROM Poor design of measures: conceptualization error Poor operationalization Misinformation or bias by ethnographers and informants Coder bias or insufficient attention
Any lack of fit between the theoretical construct and the measure increases error Error that departs from the theoretical construct is likely to be systematic error Avoid proxy (indirect) measures Aim for higher face validity or content validity If possible, aim for low inference variables POOR CONCEPTUALIZATION
LOW VERSUS HIGH INFERENCE VARIABLES Low inference variables--traits or customs that are highly visible, often reported by ethnographers and easily located (e.g., presence of plow, shape of dwellings, rule of marital residence) Moderate inference variables-- frequency of war, sexual division of labor, proportion of day an infant is carried. (Whiting 1981; Bradley 1987, 1989) High inference variables--global attitudes and values (e.g., status of women, evaluation of children, optimism or pessimism)
Not fitting the measure to the information available in ethnography Coding of variables requires too much inference Insufficient instructions needed for How and where to find information Specifying how to attend to the time and place focus required How to judge the absence of a trait POOR OPERATIONALIZATION
TIME AND PLACE FOCUS Divale (1975) has shown that if a researcher fails to focus on a time and a place, correlations between variables that are presumably functionally or causally related will decrease. For example, in the Probability Sample Files, the phi coefficient between type of warfare (internal versus purely external) and residence (patrilocal versus matrilocal) is .58 if unfocused, but .71 if focused. What criteria can be used for choosing a focus? Most researchers use the focus specified in a sample, such as the Ethnographic Atlas or the Standard Cross-Cultural Sample But other criteria are certainly plausible, such as the earliest date if you want to study warfare before pacification attempts, or the latest if you want to study modernization, or the ethnographer with the most information on your subject.
HOW TO JUDGE ABSENCE OF A TRAIT One of the worst mistakes to make is to let coders infer the absence of a trait from the lack of information on the topic. This is because ethnographers do not go with a checklist and therefore do not cover every topic The coding rules should clearly tell the coder how to infer absence of a trait. For example, to infer the absence of warfare for a particular time period, the ethnographer must cover intercommunity relationships and intersocietal relationships to be confident that war would have been mentioned if it had occurred.
ERROR BY ETHNOGRAPHERS AND INFORMANTS In one sense there is nothing that can be done about ethnographer or informant errors, particularly if there was only one main ethnographer who talked with a few main informants. Other solutions: Consult other sources to see if there general agreement on the presence or absence of particular traits. However, you can design data quality scores to rate the type of information that an ethnographer provided and you can re-analyze data with and without lower quality scores Strong caution--if different ethnographers disagree, do not assume that one is right and one is wrong especially if they are there in different times and places
DATA QUALITY SCORE 1) Ethnographer provided specific counts of episodes of war in the appropriate time frame or explicitly reported that they were not fighting during this time period. Ethnographer had general (qualitative) statements of frequency and provided details of war incidents and/or inter-community/inter-society relationships to indicate that topic was of interest in the appropriate time period. Ethnographer had summary statement with little supporting evidence or details in the appropriate time period. Ethnographer provided anecdotes or examples in the appropriate time period without a summary statement or an assessment of frequency. Information provided was confusing, or contradictory. 2) 3) example for warfare frequency* 4) 5) *assumes that operational definitions of warfare frequency are already provided along with an appropriate time and place focus
A DATA QUALITY SCORE FOR TIME/PLACE FOCUS In some coding schemes the researcher might ask the coders not to make a judgment if the time/place foci are not matched However, another alternative is to allow coding the variables somewhat outside the specified foci, but additionally include a data quality score that captures the degree of departure from the foci Can analyze with different degrees of time/place focus
CODER BIAS--HOW TO MINIMIZE ERROR If the researcher is the only coder Solutions Why is this a problem? To avoid unconscious bias toward the hypothesis, consider using measures of one of the important variables from another researcher If the researcher rates both independent and dependent variables, do the ratings in different passes to minimize bias toward the hypothesis Provide quotes, sources and page numbers for decisions Possibility of unconscious cheating towards the hypothesis tested Possibility of bias from theoretical orientation May miss important information if the only coder But there may be advantages to experienced coder Less apt to take words at face value More knowledgeable about what the measure means More likely to attend to appropriate focus
CODER BIAS--HOW TO MINIMIZE ERROR-2 Solutions Use naive coders who doesn t know the hypothesis Make codes and procedures detailed enough so that bias is minimized Specify appropriate documents to read Require documentation for decisions and if possible copies of relevant passages for review Point out well-known biases in coding instructions Use experts to review judgments for complex cases (see Slingerland et al. 2020) If possible hire more expert coders Use two or more coders to assess reliability Disadvantages More subject to ethnocentric bias (Bradley 1987) Less likely to understand nuances of ethnographic wording Particularly in complex societies with voluminous material, a naive coder may be overwhelmed Advantages Not likely to have theoretical bias towards hypothesis
1. Spell out theoretical and operational definitions Aim for high face validity If possible, avoid high inference variables Have clear instructions for coders, including how to judge the absence of a trait For a synchronic comparison, adhere to the same time and place foci for each society. Pre-test all coding schemes to see if they are achievable Consider a data quality score 2. 3. 4. Summing Up: Steps to Minimize Error in Measurement 5. 6. 7.
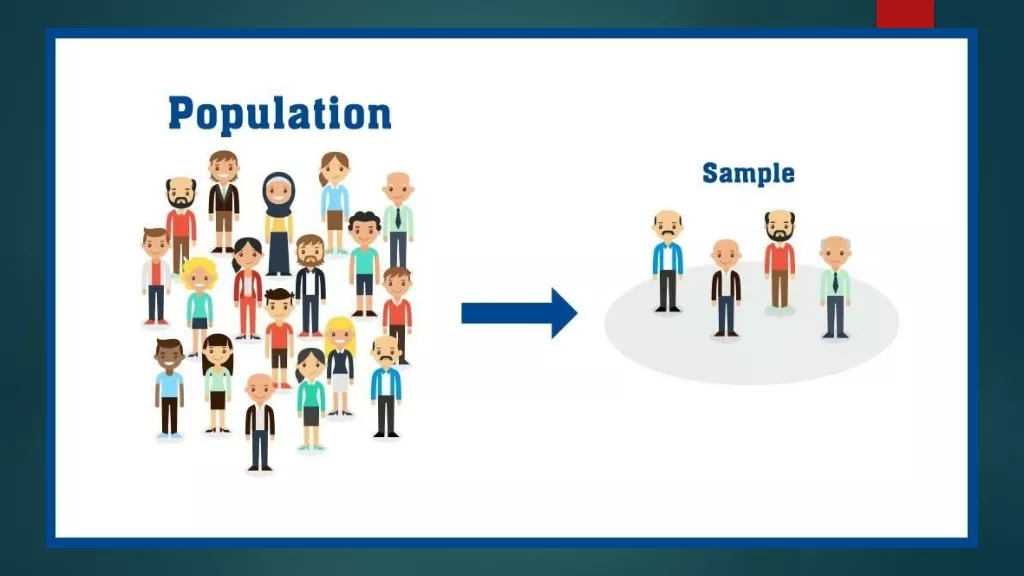
SAMPLING FOR WORLDWIDE CROSS-CULTURAL COMPARISONS
WHY SAMPLE? Sampling, if done properly, is more economical May yield higher quality data if researchers are not rushed. Very accurate results can be obtained from samples if they are representative
There is no accepted complete list of the world s cultures to give us an excellent list to sample from Perhaps most widely used with over 1200 societies is the Ethnographic Atlas (Murdock 1967-1971). Many coded variables appear in D-PLACE.org. Most cross-cultural researchers have used samples that claim to be representative SAMPLING IN CROSS-CULTURAL RESEARCH
WHAT KIND OF SAMPLE IS EHRAF WORLD CULTURES? Has a wide variety of societies and cultures, including ethnic and regional cultures, but was developed somewhat opportunistically, so as a whole should not be considered a representative sample for systematic testing of hypotheses. But there are 2 samples in eHRAF considered representative
Probability Sample Files (PSF)See Naroll 1967. 60 societies included in eHRAF World Cultures that met data quality criteria Standard Cross-Cultural Sample (SCCS) Murdock and White 1969 186 societies with pinpointed time and place bibliography; currently included in eHRAF World Cultures SAMPLES Representative samples included in eHRAF
FURTHER DESIGN AND ANALYSIS The discussion here only referred to simple hypotheses with two variables; these can be tested with bivariate statistics Most researchers control on a number of variables known to be related to the variables of interest or perform multivariate analyses that are beyond the scope of this presentation. However, no matter how many variables considered, the principles remain Clear hypotheses to be tested Clear definitions of the relevant variables Try to maximize validity and reliability Clear operational procedures for measuring all variables Transparency in sampling design Acknowledgement of limitations
ADDITIONAL RESOURCES Ember, Carol R. and Melvin Ember (2009). Cross-Cultural Research Methods, 2nd edition. See other resources on HRAF s home page under Cross-Cultural Research. Note: most of this presentation is based on Ember and Ember 2009.
REFERENCES Bradley, Candice. 1987. "Women, children and work." PhD diss., University of California, Irvine. Bradley, Candice. 1987. Reliability and inference in the cross-cultural coding process." Journal of Quantitative Anthropology 1, no. 4 (1989): 353-371. Divale, William Tulio. 1975. Temporal focus and random error in cross-cultural hypothesis tests. Behavior Science Research 10, no. 1: 19-36. Ember, Carol R. and Melvin Ember. 2009. Cross-cultural research methods. 2nd edition. AltaMira. Ember, Carol R., Marc Howard Ross, Michael L. Burton, and Candice Bradley. 1991. Problems of measurement in cross-cultural research using secondary data. Behavior Science Research 25, no. 1-4): 187-216. Murdock, George P. 1962-1971. Ethnographic Atlas, Installments I-XXVII, Ethnology 1-10. Now included in D- PLACE.ORG. Murdock, George P. 1967. Ethnographic Atlas: A Summary. University of Pittsburgh Press. Also Ethnology 6:109- 236.
REFERENCES CONT. Murdock, George P., and Douglas R. White. 1969. Standard Cross-Cultural Sample. Ethnology 8:329-369. Naroll, Raoul. 1967. The Proposed HRAF Probability Sample. Behavior Science Notes 2:70-80. Naroll, Raoul. 1962. Data quality control, a new research technique: Prolegomena to a cross-cultural study of culture stress. New York: The Free Press of Glencoe, 1962. Naroll, Raoul. 1970. Data quality control in cross-cultural surveys. 1970. In Naroll, Raoul, and Ronald Cohen, eds. A handbook of method in cultural anthropology. Natural History Press. Slingerland, Edward, Quentin D. Atkinson, Carol R. Ember, Oliver Sheehan, Michael Muthukrishna, Joseph Bulbulia, and Russell D. Gray. 2020. "Coding culture: challenges and recommendations for comparative cultural databases." Evolutionary Human Sciences 2. Whiting, John W. M. 1981. Environmental constraints on infant care practices. In Munroe, R. L.., R. H. Munroe, and B Whiting, eds. Handbook of cross-cultural human development. Garland STPM, pp. 155-179.


—See")