Crust-Core Transition in Neutron Stars: Symmetry Energy and Laboratory Constraints
Discover how the symmetry energy influences the pressure and density of the crust-core transition in neutron stars. Explore topics like Equation of State, Laboratory Constraints, and Symmetry Energy. Learn about adiabatic instability and spinodal decomposition, as well as the conditions at the crust-core boundary. Stay informed about the latest research on symmetry energy constraints at various densities.

Download Presentation

Please find below an Image/Link to download the presentation.
The content on the website is provided AS IS for your information and personal use only. It may not be sold, licensed, or shared on other websites without obtaining consent from the author. If you encounter any issues during the download, it is possible that the publisher has removed the file from their server.
You are allowed to download the files provided on this website for personal or commercial use, subject to the condition that they are used lawfully. All files are the property of their respective owners.
The content on the website is provided AS IS for your information and personal use only. It may not be sold, licensed, or shared on other websites without obtaining consent from the author.
E N D
Presentation Transcript
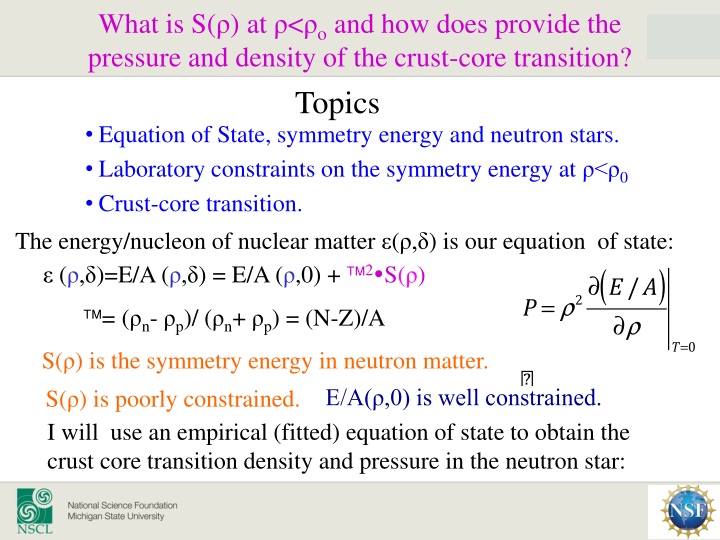
What is S() at <o and how does provide the pressure and density of the crust-core transition? Topics Equation of State, symmetry energy and neutron stars. Laboratory constraints on the symmetry energy at < 0 Crust-core transition. The energy/nucleon of nuclear matter ( , ) is our equation of state: ( ) ( , )=E/A ( , ) = E/A ( ,0) + 2 S( ) P = r2 E/A = ( n- p)/ ( n+ p) = (N-Z)/A S( ) is the symmetry energy in neutron matter. S( ) is poorly constrained. E/A( ,0) is well constrained. r T=0 ? ? I will use an empirical (fitted) equation of state to obtain the crust core transition density and pressure in the neutron star:
c < 0 > 0 At the crust-core boundary uniform matter becomes adiabatically unstable to break into isolated liquid structures surrounded by neutron-rich gas.
Adiabatic instability and spinodal decomposition As a function of temperature and density, the nuclear matter phase diagram has regions of gas, liquid, and mixed phases. These are shown for two different values of the proton fraction: y= p/( p + n ). y=0.3 and y=0.5. Inside the mixed phase region (in pink), there is the adiabatic spinodal AS within which uniform matter becomes mechanically unstable. (compressibility becomes negative) This defines the crust-core boundary in the thermodynamic limit. The region of the adiabatic spinodal gets smaller and the boundary at T=0 moves towards =0.08 fm-3 (1/2 saturation density) and perhaps even beyond with decreasing y. y=0.3 M ller and Serot, PRC 51 (1995) 2072. T (MeV) gas liquid crust-core transition y=0.5 gas liquid T (MeV) (fm-3)
Conditions of the crust core boundary from adiabatic spinodal Inside a neutron star nuclear matter is highly frustrated. The Coulomb interaction requires similar proton and electron Fermi momenta, but the associated electron Fermi energy drives matter toward pure neutron matter. The nuclear matter EoS strongly prefers symmetric matter. This trade-off between symmetry energy and electron Fermi energy sets the asymmetry. It therefore depends on the nuclear interaction and the matter density. The crust core transition occurs at the density where the proton fraction at the adiabatic spinodal equals that given by beta equilibrium. This occurs around 0.8fm-3 and depends on the density dependence of the symmetry energy. We therefore need to know the symmetry energy very well near =0.8fm-3 . from beta equilibrium Ducoin et al, C 83, 045810 (2011)
Densities and probes Now I will summarize some past and current efforts to constrain the symmetry energy at various densities To make reference to existing work, I will make use of the Taylor expansion about 0 0.16fm-3, and the expansion parameters S0, L and Ksym r r0 J \ 2 +Ksym r r0 S r ( )= S0+L -1 -1 +... 3 18 Many theoretical analyses of experimental data have focused on determining that values for S0 and L that correspond to the theoretical interactions that best describe the experimental data. Later, I will discuss expanding about 2/3 0.
Masses B.A. Brown, Phys. Rev. Lett. 111, 232502 (2013) Alex Brown fit the masses of doubly closed shell nuclei, while setting different values for the neutron skin thickness of Rnp=0.16, 0.20 and 0.24 fm. All Brown fits provide S( )=24.8 0.7 MeV at / 0=0.63 .03 as shown at left. The values for S0 and L lie on a line in the S0and L plane along which S(0.63 0) remains constant. This line lies perpendicular to the gradient of S(0.63 0) in the the S0 and L plane. The slope, M, of the line and the form of the function is sufficient to determine / 0=0.63 .03 and S( )=24.8 0.7 MeV. From the slope of the IAS contour (in blue) one similarly obtains / 0=0.66 .04 and S( )=25.5 1.1 MeV. (31, 40) ( ) ( ); ( )= - S rs ( ) L ( ) S0 M rs M depends monotonically on rs S rs
Probe: Isospin diffusion in peripheral collisions Collide projectiles and targets of differing isospin asymmetry Probe the asymmetry =(N-Z)/(N+Z) of the projectile spectator during and after the collision. Systems{ mixed 124Sn+112Sn n-rich 124Sn+124Sn p-rich 112Sn+112Sn + ( / ) 2 both _ neut . rich both _ prot . rich = R ( ) 2 Tsang et al., PRL 92 (2004) 062701 i Neutron-rich projectile both _ neut . rich both _ prot . rich 124Sn R=1 no diffusion Larger L R= -1: no diffusion 112S Smaller L Neutron-deficient target R= 0 equilibrium R= 0: equilibrium measure asymmetry after collision
Consider the EoSs for which the agreement is at the 2 boundaries of the constraint contour High L boundary Low L boundary ? L-S0 constraint contour actually corresponds to a constraint of S( s)=10.6 1 MeV at / 0=0.24 0.07. Diffusion ends when the density becomes low enough that the symmetry energy gradient across neck becomes negligible
Isobaric Analog states Information that is equivalent to the isotopic dependences of the masses can be by fitting the energies of ground and isobaric analog states within the same nuclei. If all states are fitted together, one obtains / 0=0.66 .04 and S( )=25.5 1.1 MeV. Fitting different mass ranges maps to different density ranges. By fitting Isobaric Analog States with 30 A 240, Danielewicz obtained constraints on the symmetry energy over a range of densities using a Pearson correlation technique. Light nuclei are sensitive to lower densities than are heavy nuclei. P. Danielewicz, and J. Lee, Nucl. Phys. A 922, 1 (2014). Danielewicz (2006)
Electrical dipole polarizability Zhang PRC 92, 031301 (2015). The dipole polarizability of a nucleus tells how the ground state energy changes in a dipole electric field. Perturbation theory tells us Large contribution from GDR Low energy non-collective excitations have enhanced importance. Latter measured by (p,p ) coulex. Analyzed by Pearson correlation technique. S( ) The red contour shows the constraint on S( ) consistent with the D measurement. The best determined value is S( )=15.9 1.0MeV at =0.05 fm-3, which is marked as the yellow square point in the figure.
Combining constraints Lynch and Tsang (2018) The individual points give the best values from masses, IAS, isospin diffusion and D. Blue shaded region is CEFT prediction by Drischeler et al., The dashed region is the Pearson analysis of Danielewicz for the IAS data. Following Ducoin et al, C 83, 045810 (2011) you can fit these five points to obtain a best fit Taylor expansion of S( ) about =0.1/fm3 Ducoin et al, showed that such an expansion can be used to obtain the crust-core transition density and pressure. The result of the fit are shown as the solid line. The dashed lines show the 2 boundaries for S( ). The constraint is remarkable similar to that of Danielewicz to IAS data.
For crust core transition, is it better to expand around 2/3 0? Ducoin et al. calculated crust-core transitions for about 50 Skyrme and RMF interactions. Figure shows the correlation between Yp,td, Ptd and td and coefficients of Taylor expansion about 0 (J, L, Ksym) and about 2/3 0 (J01, L01, Ksym01). Solid points are for EoS from Skyrme interactions and open are from relativistic mean field (RMF) interactions. The expansions about 2/3 0 provide more precise constraints on the crust- core transition because that point is closer to the actual crust-core transition density. Our most precise constraints are at 2/3 0 , so that is also the most precise point about which to expand. expand about 2 0/3 expand about 0 asljsafl ?rtd ?Ytd ?Ptd
Combining constraints Lynch and Tsang (2018) The individual points give the best values from masses, IAS, isospin diffusion and D. Blue shaded region is CEFT prediction by Drischeler et al., The dashed region is the Pearson analysis of Danielewicz for the IAS data. Following Ducoin et al, C 83, 045810 (2011) you can fit these five points to obtain a best fit Taylor expansion of S( ) about =0.1/fm3 Ducoin et al, showed that such an expansion can be used to obtain the crust-core transition density and pressure. The location for the crust-core transition density is shown as data point. The contours are pressure contours obtained from NS mass-radius correlation (Steiner et al.) and from neutron star mergers (Abbot et al). Can we get more points to improve the crust core transition density and pressure? x x Lynch and Tsang (2018)
Constraints from ratios of neutron/proton spectra in central 124Sn+124Sn and 112Sn+112Sn collsions P. Morfouace et al., (2018) P. Morfouace et al., (2018) Four dimensional Bayesian analyses of spectral ratios using Madai: Parameters: S0, L, and We obtain S/ 0= 0.56 0.9 and S( S) = 20.5 1.9 MeV. m*np=(0.03 0.08) Somewhat lower than the trend of global fit, but within uncertainties. * * mn mp
Pointing towards higher densities Neutron and Asymmetry skins Concerning asymmetry skins, Danielewicz and Lee extracted the asymmetry skins and included them as constraint on S( ). With increasing value of L, the neutron matter distribution shifts to larger radii, which has two effects: Neutron skin n-p Asymmetry skins: shift between radii and diffuseness of isoscaler and isovector potentials. Determined by fitting optical potentials for elastic scattering and charge exchange. We can expect the current information about neutron skins to improve from new measurements including PREX 2 and CREX. It would be interesting to see how this extra constraint changes the crust core transition density and pressure.
Summary Most nuclear observables probe sub-saturation densities. It is useful to determine the sensitive density probed by each observable and then extract the symmetry energy at that density. This extraction is less model dependent than generally expected. This provides constraints on S( ) for 0.25< / 0<0.75 that are remarkably consistent with those extracted from Pearson correlation analyses of IAS. These experimental constraints are precisely what is needed to determine the crust-core transition asymmetry, pressure and density.
 at ρ<ρo and how does provide the")


![Prevention and Combating of Hate Crimes and Hate Speech Bill [B.9B.2018]](/thumb/60513/prevention-and-combating-of-hate-crimes-and-hate-speech-bill-b-9b-2018.jpg)

![Stakeholders' Responses to National Health Insurance Bill [B.11B-2019]: Overview](/thumb/69945/stakeholders-responses-to-national-health-insurance-bill-b-11b-2019-overview.jpg)