Current Financial Situation Trends 2022
Analyzing global data on the cost of living and financial situations reveals interesting trends among different demographics, education levels, and regions. The percentages reflect varying levels of comfort or struggle with finances, shedding light on the economic landscape worldwide. Understanding these statistics can provide valuable insights into how individuals are managing their financial well-being in the current economic climate.
Download Presentation

Please find below an Image/Link to download the presentation.
The content on the website is provided AS IS for your information and personal use only. It may not be sold, licensed, or shared on other websites without obtaining consent from the author.If you encounter any issues during the download, it is possible that the publisher has removed the file from their server.
You are allowed to download the files provided on this website for personal or commercial use, subject to the condition that they are used lawfully. All files are the property of their respective owners.
The content on the website is provided AS IS for your information and personal use only. It may not be sold, licensed, or shared on other websites without obtaining consent from the author.
E N D
Presentation Transcript
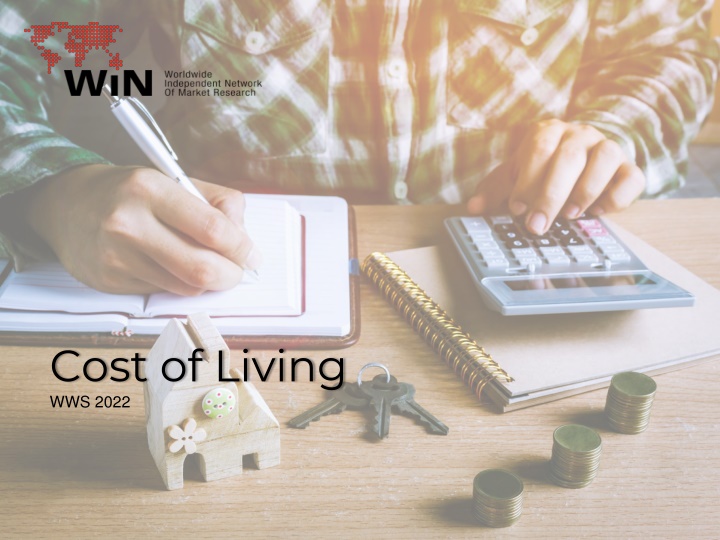
Cost of Living WWS 2022 1
W Which hichof the following best describes of your current financial of the following best describes of your current financial situ situation ation? ? Cost of living Cost of living % Within total sample By gender By gender Total Total 23% 23% 27% 27% 38% 38% 34% 34% 36% 36% 36% 36% 25% 36% By age group By age group 25% 38% 38% 39% 40% 34% 41% 36% 37% 34% 35% 34% 41% 25% 23% 25% 31% 23% 23% 18 to 24 25 to 34 35 to 44 45 to 54 55 to 64 65+ Neither comfortable nor struggling Struggling financially to make ends meet Living comfortably Source: WIN 2022. Base: 29739 The percentages corresponding to the option Does not know/does not answer have not been included 2
W Which hichof the following best describes of your current financial of the following best describes of your current financial situ situation ation? ? Cost of living Cost of living % Within total sample By education level By education level By employment By employment Working full (include self-employed) 28% Completed Higher level of education (Masters, PHD, etc.) 39% 32% 43% 33% 25% Working Part-time 27% Completed University 27% 31% 40% 42% 32% Unemployed 14% 28% 53% Completed Secondary School 22% Student 39% 39% 21% 38% 37% Completed Primary Housewife 22% 30% 47% 19% 41% 37% No education / Only basic education Retired/Disabled 30% 22% 24% 54% 41% 26% Neither comfortable nor struggling Struggling financially to make ends meet Living comfortably Source: WIN 2022. Base: 29739 The percentages corresponding to the option Does not know/does not answer have not been included 3
Which of the following best describes of your current financial situation? Which of the following best describes of your current financial situation? % within total population Neither comfortable nor struggling Struggling financially to make ends meet Living comfortably 29% Europe 41% 26% 55% 44% 31% MENA 16% Americas 55% APAC 38% 29% 30% 23% 29% Africa 12% 33% Source: WIN 2022. Base: 29739 The percentages corresponding to the option Does not know/does not answer have not been included 4
W Which hichof the following best describes of your current financial of the following best describes of your current financial situ situation ation? ? Cost of living Cost of living % Within total sample 14% 15% 23% 26% 25% 24% 24% 26% 30% 28% 31% 29% 28% 20% 35% 31% 35% 34% 29% 36% 42% 28% 34% 33% 45% 48% 48% 41% 51% 52% 43% 57% 70% 65% 69% 25% 26% 29% 76% 55% 26% 34% 55% 39% 23% 30% 41% 44% 40% 38% 33% 48% 37% 66% 60% 41% 4% 39% 37% 38% 38% 57% 34% 57% 32% 42% 42% 33% 48% 48% 45% 42% 20% 15% 38% 38% 37% 37% 34% 34% 25% 31% 11% 27% 27% 26% 26% 25% 25% 25% 21% 20% 18% 17% 17% 16% 16% 14% 13% 12% 11% 10% 10% 9% 9% 8% 4% 4% FRANCE FRANCE PERU PERU IRELAND IRELAND NIGERIA NIGERIA CANADA CANADA THAILAND THAILAND ECUADOR ECUADOR PAKISTAN PAKISTAN LEBANON LEBANON SERBIA SERBIA MALAYSIA MALAYSIA REP. OF KOREA REP. OF KOREA NETHERLANDS NETHERLANDS VIETNAM VIETNAM SPAIN SPAIN INDIA INDIA PHILIPPINES PHILIPPINES IVORY COAST IVORY COAST KENYA KENYA MEXICO MEXICO TURKEY TURKEY CROATIA CROATIA ARGENTINA ARGENTINA UK UK ITALY ITALY POLAND POLAND HONG KONG HONG KONG JAPAN JAPAN FINLAND FINLAND GERMANY GERMANY PARAGUAY PARAGUAY SLOVENIA SLOVENIA CHILE CHILE GREECE GREECE BRAZIL BRAZIL UNITED STATES UNITED STATES Neither comfortable nor struggling Struggling financially to make ends meet Living comfortably Source: WIN 2022. Base: 29739 The percentages corresponding to the option Does not know/does not answer have not been included 5
As a result of the rising cost of living, which of the following statements best describe your situation? As a result of the rising cost of living, which of the following statements best describe your situation? Cost of living Cost of living % Within total sample By gender By gender Total Total 50% 50% 46% 46% 29% 29% 28% 28% 17% 17% 19% 21% 21% By age group By age group 48% 17% 19% 18% 18% 24% 21% 27% 29% 29% 33% 34% 23% 26% 49% 46% 50% 51% 43% 49% 18 to 24 25 to 34 35 to 44 45 to 54 55 to 64 65+ I have already reduced some expenses in the past months I am actively planning to reduce expenses in the next months I am NOT planning on making changes by now, in the next months Source: WIN 2022. Base: 29739 The percentages corresponding to the option Does not know/does not answer have not been included 6
As a result of the rising cost of living, which of the following statements best describe your situation? As a result of the rising cost of living, which of the following statements best describe your situation? Cost of living Cost of living % Within total sample By education level By education level By employment By employment Completed Higher level of education (Masters, PHD, etc.) Working full (include self-employed) 46% 31% 21% 46% 28% 24% Working Part-time Completed University 50% 30% 17% 47% 30% 20% Unemployed 53% 26% 14% Completed Secondary School 49% 29% 18% Student 43% 34% 17% Completed Primary Housewife 47% 28% 19% 47% 29% 19% No education / Only basic education Retired/Disabled 50% 26% 19% 52% 22% 22% I have already reduced some expenses in the past months I am actively planning to reduce expenses in the next months I am NOT planning on making changes by now, in the next months Source: WIN 2022. Base: 29739 The percentages corresponding to the option Does not know/does not answer have not been included 7
As a result of the rising cost of living, which of the following statements best describe your situation? As a result of the rising cost of living, which of the following statements best describe your situation? % within total population I have already reduced some expenses in the past months I am actively planning to reduce expenses in the next months I am NOT planning on making changes by now, in the next months 24% 18% Europe 54% 29% 27% 16% 17% MENA Americas 25% 36% 53% 35% 52% APAC 12% Africa 36% 50% Source: WIN 2022. Base: 29739 The percentages corresponding to the option Does not know/does not answer have not been included 8
As a result of the rising cost of living, which of the following statements best describe your situation? As a result of the rising cost of living, which of the following statements best describe your situation? Cost of living Cost of living % Within total sample 3% 8% 15% 9% 10% 10% 13% 13% 10% 12% 18% 16% 21% 17% 19% 18% 18% 22% 19% 20% 21% 20% 17% 21% 16% 16% 21% 25% 29% 16% 22% 33% 21% 19% 43% 26% 29% 23% 24% 23% 22% 50% 20% 34% 31% 33% 18% 27% 24% 26% 23% 30% 25% 29% 43% 28% 36% 23% 31% 31% 30% 41% 24% 30% 23% 28% 15% 30% 32% 33% 45% 30% 70% 70% 63% 62% 62% 60% 59% 55% 54% 54% 53% 53% 53% 52% 52% 51% 51% 50% 49% 49% 49% 48% 46% 46% 45% 45% 45% 44% 42% 42% 42% 38% 35% 28% 26% 19% FRANCE FRANCE PERU PERU NIGERIA NIGERIA CANADA CANADA IRELAND IRELAND PAKISTAN PAKISTAN ECUADOR ECUADOR SERBIA SERBIA THAILAND THAILAND LEBANON LEBANON MALAYSIA MALAYSIA PHILIPPINES PHILIPPINES VIETNAM VIETNAM REP. OF KOREA REP. OF KOREA SPAIN SPAIN IVORY COAST IVORY COAST NETHERLANDS NETHERLANDS KENYA KENYA INDIA INDIA ARGENTINA ARGENTINA MEXICO MEXICO ITALY ITALY TURKEY TURKEY CROATIA CROATIA HONG KONG HONG KONG JAPAN JAPAN FINLAND FINLAND UK UK POLAND POLAND PARAGUAY PARAGUAY GREECE GREECE CHILE CHILE BRAZIL BRAZIL GERMANY GERMANY SLOVENIA SLOVENIA UNITED STATES UNITED STATES I have already reduced some expenses in the past months I am actively planning to reduce expenses in the next months I am NOT planning on making changes by now, in the next months Source: WIN 2022. Base: 29739 The percentages corresponding to the option Does not know/does not answer have not been included 9
Total of 29739 surveys worldwide METHODOLOGY Dates: Oct 9th to Dec 10th2022 COUNTRY COMPANY METHODOLOGY SAMPLE SIZE COVERAGE ARGENTINA Voices Research & Consultancy CAWI 621 NATIONAL BRAZIL Market Analysis Brazil CAWI 1000 NATIONAL CANADA LEGER CAWI 1000 NATIONAL CHILE Activa Research CAWI 1004 NATIONAL CROATIA Mediana Fides CAWI 540 NATIONAL FACE-TO- FACE/CAPI CAWI ECUADOR CEDATOS 620 NATIONAL FINLAND TaloustutkimusOy 1042 NATIONAL FRANCE BVA CAWI 1000 NATIONAL GERMANY Produkt+Markt CAWI 1000 NATIONAL GREECE Alternative Research Solutions CAWI 500 NATIONAL HONG KONG Consumer Search Group (CSG) CAWI 501 TERRITORY WIDE INDIA DataPrompt International Pvt. Ltd. CAWI 1000 NATIONAL REPUBLIC OF IRELAND ITALY RED C Research & Marketing Ltd CAWI 1015 NATIONAL BVA Doxa CAWI 1001 NATIONAL EMC SARL CATI 508 IVORY COAST NATIONAL JAPAN Nippon Research Center, LTD. Mind Pulse Research & Consulting Ltd REACH SAL CAWI 1236 NATIONAL KENYA CATI 500 Key Urban Areas LEBANON CATI 500 NATIONAL MALAYSIA MEXICO Central Force International Sdn.Bhd. Brand Investigation S.A de C.V CAWI Online 1003 535 NATIONAL NATIONAL 10
Total of 29739 surveys worldwide METHODOLOGY Dates: Oct 9th to Dec 10th2022 SAMPLE SIZE 1003 COUNTRY COMPANY METHODOLOGY COVERAGE NIGERIA Market Trends International CATI NATIONAL PAKISTAN Gallup Pakistan CATI 1000 NATIONAL PARAGUAY ICA Consultor a Estrat gica CATI 501 NATIONAL PERU Datum Internacional Philippine Survey and Research Center, Inc. (PSRC) Mareco Polska CAWI 1003 URBAN NATIONAL PHILIPPINES F2F CAPI 1001 NATIONAL POLAND REPUBLIC OF KOREA CAWI 509 NATIONAL Gallup Korea CAPI 1549 NATIONAL SERBIA Mediana Adria CAWI 520 NATIONAL SLOVENIA Mediana CAWI 501 NATIONAL SPAIN Instituto DYM CAWI 1006 NATIONAL THAILAND THE NETHERLANDS TURKEY UNITED KINGDOM USA Infosearch Limited CAPI 500 NATIONAL Motivaction International B.V. CAPI 1011 NATIONAL Barem CATI 708 NATIONAL ORB International CAWI 1018 NATIONAL LEGER CAWI 1000 NATIONAL Hanoi, Ho Chi, Minh City, Da Nand, Can Tho VIETNAM Indochina Research CAPI 800 11
