Cutoff Value for Prominent Breast Cancer Biomarkers on Survival
HER2, ER, PR, and ERBB2 are key biomarkers in breast cancer treatment. This study focuses on determining threshold values for these biomarkers to assess survival risk. CART analysis is employed for classification, with hazard ratio and confidence interval calculations. The study aims to enhance understanding of biomarker-specific treatment strategies for breast cancer patients.
Download Presentation

Please find below an Image/Link to download the presentation.
The content on the website is provided AS IS for your information and personal use only. It may not be sold, licensed, or shared on other websites without obtaining consent from the author.If you encounter any issues during the download, it is possible that the publisher has removed the file from their server.
You are allowed to download the files provided on this website for personal or commercial use, subject to the condition that they are used lawfully. All files are the property of their respective owners.
The content on the website is provided AS IS for your information and personal use only. It may not be sold, licensed, or shared on other websites without obtaining consent from the author.
E N D
Presentation Transcript
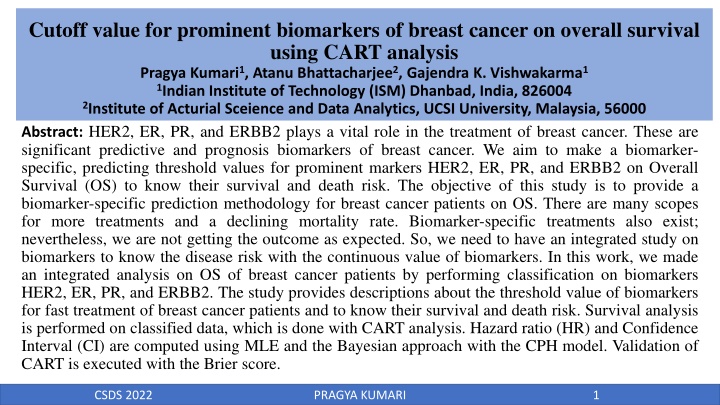
Cutoff value for prominent biomarkers of breast cancer on overall survival using CART analysis Pragya Kumari1, Atanu Bhattacharjee2, Gajendra K. Vishwakarma1 1Indian Institute of Technology (ISM) Dhanbad, India, 826004 2Institute of Acturial Sceience and Data Analytics, UCSI University, Malaysia, 56000 Abstract: HER2, ER, PR, and ERBB2 plays a vital role in the treatment of breast cancer. These are significant predictive and prognosis biomarkers of breast cancer. We aim to make a biomarker- specific, predicting threshold values for prominent markers HER2, ER, PR, and ERBB2 on Overall Survival (OS) to know their survival and death risk. The objective of this study is to provide a biomarker-specific prediction methodology for breast cancer patients on OS. There are many scopes for more treatments and a declining mortality rate. Biomarker-specific treatments also exist; nevertheless, we are not getting the outcome as expected. So, we need to have an integrated study on biomarkers to know the disease risk with the continuous value of biomarkers. In this work, we made an integrated analysis on OS of breast cancer patients by performing classification on biomarkers HER2, ER, PR, and ERBB2. The study provides descriptions about the threshold value of biomarkers for fast treatment of breast cancer patients and to know their survival and death risk. Survival analysis is performed on classified data, which is done with CART analysis. Hazard ratio (HR) and Confidence Interval (CI) are computed using MLE and the Bayesian approach with the CPH model. Validation of CART is executed with the Brier score. CSDS 2022 PRAGYA KUMARI 1
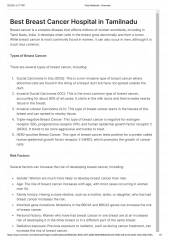
Background: According to GLOBOCAN 2020, estimated new cases were 2,261,419 (24.5% of all new women cancer cases) and 684,996 new deaths (15.5% of all new women cancer deaths) of breast cancer in 2020 worldwide. HER2, ER, PR, and ERBB2 are the prominent biomarkers of breast cancer. Existing treatments for breast cancer, when the cell has the receptors for estrogen-positive (ER+) and progesterone positive (PR+), are more likely to respond to the hormonal therapy than the tumor is ER- or PR-. Approximately 75% of breast cancer are found to be ER+, and 65% to 75% are found to be PR+. Tamoxifen and Raloxifene have been in use since previous years to prevent breast cancer. These hormonal therapies are used for women at high risk of breast cancer. Recently, aromatase inhibitors (e.g., Anastrozole, Exemestane, and Letrozole) are used to prevent the advanced ER+ breast cancer type. If the protein asset is found hormone receptor-negative, then hormonal therapy is not going to work. In that case, it can be treated along with chemotherapy, surgery, or radiation therapy. Motivation: As the scenario of biomarkers is characteristic, it varies from one geographical location to another geographical location. So, we need to have an integrated study on biomarkers to know the risk of disease with the continuous value of biomarkers HER2, ER, PR, and ERBB2. In an article, the Bayesian approach has been performed to find a classification tree using CART analysis (motivation). An integrated analysis on overall survival (OS) of breast cancer patients by performing classification on biomarkers HER2, ER, PR, and ERBB2. Knowing the risk level of any disease is the first step towards the treatment of any disease, which this study does. Descriptions of the cut-off value of biomarkers for fast survival estimation of breast cancer patients. CSDS 2022 PRAGYA KUMARI 2
Material and Methods: Studied overall survival for breast cancer patients using datasets (GSE3494, GSE7390, GSE16446, GSE20685, GSE20711 and GSE48390, together include 1037 unique breast cancer patients) of clinical data and continuous-valued genomic data, taken from different geographical locations (https://www.ncbi.nlm.nih.gov/geo/). CART is used in this study to obtain a threshold value of biomarkers. Model trees were preferred to create classification on predictor variables. After performing CART analysis, the study is done on classified data. Parameters have been estimated using the CPH model and Bayesian approach. Hazard function H(t) is expressed by https://www.ncbi.nlm.nih.gov/geo/ ? ? ? = 0? ? ?=1 ??? (1) ? ?? =1 2 ? ?=1 ?? ?? (3) 0? ??1? 0(?)??2? = ??1? ??2? The Hazard ratio: ?1(?) ?2(?) = ? ? = (2) The efficiency of CART has been measured by accuracy and sensitivity (correct measurement for risk) using K-nn classifier. (Sensitivity describes the probability of correct estimation about the occurrence of the event of patients above or below the cut-off value of biomarkers HER2, ER, PR and ERBB2.) ROC curve is prepared to measure the accuracy of created classification. Risk prediction of the methodology is one of the key tasks. Brier score (BS) is used in this article to validate the accuracy of the classification model using its testing data. CSDS 2022 PRAGYA KUMARI 3
Threshold: Results: HER2 : 14.707 ER: 8.128 PR: 13.153 ERBB2: 6.884 ROC AUC value : 0.82 Brier Score Testing data: 0.16 Training data is a random selection of 880 (85%) sample size of the entire data of 1037 patients. Cut-off value for biomarkers (HER2, ER, PR, ERBB2: 14.993, 5.063, 13.153, 11.152) using CART on training data towards validating our methodology. Estimates using MLE and Bayesian for univariate and multivariable Conclusion: Here we observe that patients having HER2, less than its cut-off value, are at lower risk and greater than the cut-off value for biomarkers ER, PR, and ERBB2 are at lower risk of death. Observation shows that HR (as it decreases, the death risk decreases with it) decreases in order to HER2, ER, PR, and ERBB2 in respective order, on crossing their cut-off values. It is consistent for both univariate and multivariable cases with MLE and the Bayesian approach. Here we have used and evaluated the brier score to validate our methodology. It shows, the performed technique is relatively high. CSDS 2022 PRAGYA KUMARI 4
