Explore advanced gene analysis methods including DACIDR for clustering and dimension reduction, pairwise sequence alignment vs multiple sequence alignment, million Fungi sequences summarization, and multidimensional scaling (MDS) methods like WDA-SMACOF. Discover the latest trends in bioinformatics and bioinformatics tools for efficient analysis.
Please find below an Image/Link to download the presentation.
The content on the website is provided AS IS for your information and personal use only. It may not be sold, licensed, or shared on other websites without obtaining consent from the author. If you encounter any issues during the download, it is possible that the publisher has removed the file from their server.
You are allowed to download the files provided on this website for personal or commercial use, subject to the condition that they are used lawfully. All files are the property of their respective owners.
The content on the website is provided AS IS for your information and personal use only. It may not be sold, licensed, or shared on other websites without obtaining consent from the author.
E N D
Presentation Transcript
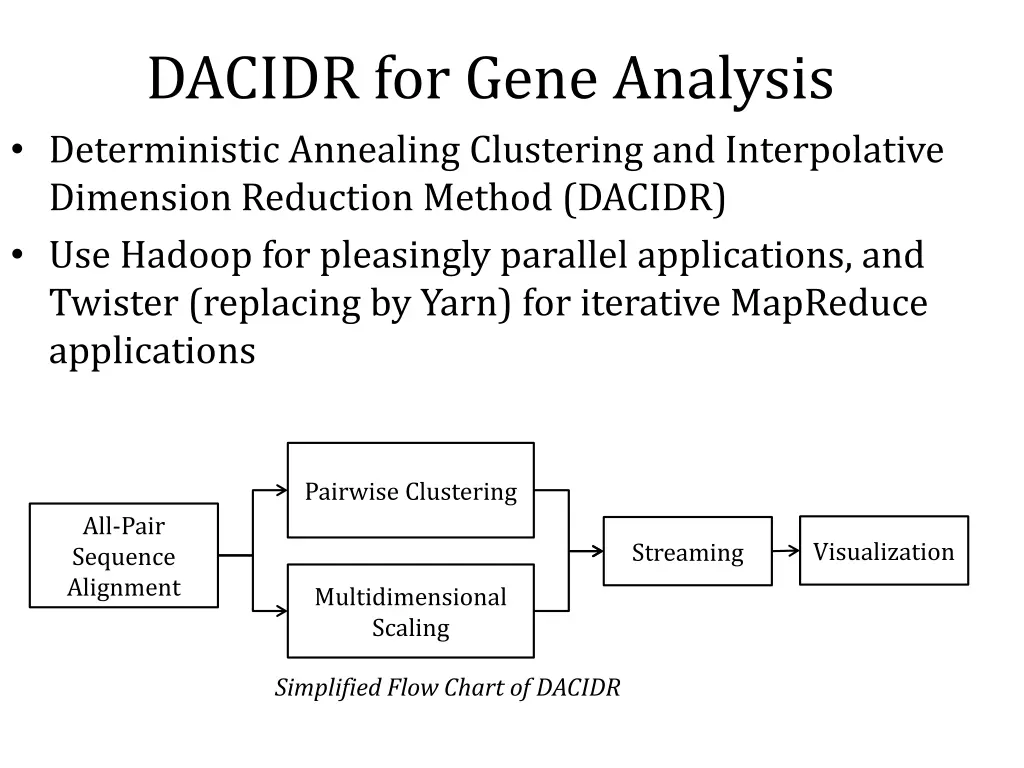
DACIDR for Gene Analysis Deterministic Annealing Clustering and Interpolative Dimension Reduction Method (DACIDR) Use Hadoop for pleasingly parallel applications, and Twister (replacing by Yarn) for iterative MapReduce applications Pairwise Clustering All-Pair Sequence Alignment Visualization Streaming Multidimensional Scaling Simplified Flow Chart of DACIDR
PWA vs MSA Pairwise sequence alignment (PWA) is much faster and has very high correlation with multiple sequence alignment (MSA). MSA SWG NW 1.2 1 0.8 Correlation 0.6 0.4 0.2 0 599nts 454 optimized The comparison using Mantel between distances generated by three sequence alignment methods and RAxML 999nts
Summarize a million Fungi Sequences Spherical Phylogram Visualization Spherical Phylogram visualized in PlotViz RAxML result visualized in FigTree.
MDS methods Sum of branch lengths will be lower if a better dimension reduction method is used. WDA-SMACOF finds global optima 599nts with 454 optimized WDA-SMACOF 999nts WDA-SMACOF LMA EM-SMACOF LMA EM-SMACOF 30 25 25 20 20 Edge Sum Edge Sum 15 15 10 10 5 5 0 0 MSA SWG NW MSA SWG NW Sum of branch lengths of the SP generated in 3D space on 599nts dataset optimized with 454 sequences and 999nts dataset