Dashboard Design: Illuminating System Impact with Jesse Jorstad
Lead Data & Program Analyst, Jesse Jorstad, shares insights from his extensive experience in homeless housing administration and data analytics. He discusses his passion for data visualization, skills in Tableau Desktop, and personal interests outside work. Discover the innovative approaches Jesse brings to Snohomish County Human Services.

Download Presentation

Please find below an Image/Link to download the presentation.
The content on the website is provided AS IS for your information and personal use only. It may not be sold, licensed, or shared on other websites without obtaining consent from the author.If you encounter any issues during the download, it is possible that the publisher has removed the file from their server.
You are allowed to download the files provided on this website for personal or commercial use, subject to the condition that they are used lawfully. All files are the property of their respective owners.
The content on the website is provided AS IS for your information and personal use only. It may not be sold, licensed, or shared on other websites without obtaining consent from the author.
E N D
Presentation Transcript
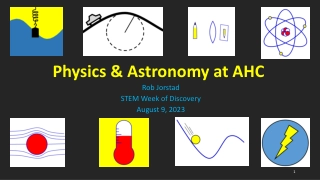
Dashboard Design: Illuminating System Impact Jesse Jorstad he/him/his Lead Data & Program Analyst Snohomish County Human Services
Jesse Jorstad he/him/his Worked in homeless housing administration for 12 years 5 in PSH rental admin 7 total with the County 2 in CoC Contract/Planning 5 in HMIS/Data analytics Certified in Tableau Desktop When I m not wrangling unruly data I spend time with these goons If I could quit my job and do anything I wanted, I would paint and blog and drink coffee. mrgender.blog Evening Comes 2
I am not My knowledge is experiential and my approach is intuitive. A statistician A researcher A data viz expert A HUD official A data standards authority With the exception of my children, I almost immediately dislike everything I have ever built. Why? Because I have acquired so many more skills and so much more knowledge than I had when I designed the project. 3
Snohomish County (WA-504) Unified Funding Agency HMIS Lead Staff Support for CoC Board 5
Stephanie Patterson, she/her/hers Steward of Data Database Customization & Optimization Lover of kitty cats Kendall Shawhan, she/her/hers Federal Reporting Tolerates Contract Management Staff Collector of Funko Pops Alex Vallandry, he/him/his World s Nicest Guy, or perhaps so nuanced in his sarcasm you think he is being polite User training, technical assistance and CHO monitoring Plays Magic - competitively 6
Two Workbooks One from scratch One downloaded from here: public.tableau.com/profile/jesse.jorstad 7
Who else is in the room? Raise your hand if you consider yourself primarily a A database administrator A data entry specialist A data analyst Evaluator/Researcher I m not into labels I am into labels, just not any of those 8
Who is paying you to be in the room? Raise your hand if you work for The government A non-profit A technical assistance provider/consultant An HMIS Vendor I could tell you but then I d have to kill you 9
Learning Objectives Understand what a data dashboard is Understand how social capital can be expended to buy your data airtime Environment Planning a Data Project Common data quality issues that impact analysis Same data, different approach Design for audience impact Data vizzing 10
Tableau Skills Connecting to a data source Joining Tables Altering Data Types Organizing the Data Pane Calculated Fields Formatting Getting to know your data set Building a Parameter Tooltips 11
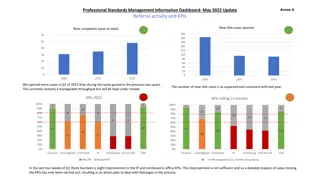
What is a data dashboard? Data Dashboards use: Data Visualization (Graphic Representation of Information) Why? At the beginning of the period, 1,250 households were enrolled in coordinated entry. During the period, 3,035 entered and 2,894 exited. At the end of the period, 1,391 remained. Humans process visual information 60,000 times faster than text. 12 http://www.t-sciences.com/news/humans-process-visual-data-better
Not all data visualization is a dashboard Charts Infographics Reports 13
Dashboards facilitate clear take away messages but allow the user to interact with the data. These interactions: Conveys the relationship between Key Performance Indicators (KPIs) Foster engagement Promotes analysis Moves audience to action 15
Write down 10-ish words that you think people would use to describe you Write down 3 words that you wish people would use to describe you 17
Before using data to change anything you have to build relationships 18
Respect, appreciation, integrity, trust and shared values Network of Relationships Social Capital as Currency Realization of goals New knowledge and resources socialcapitalresearch.com 19
Break Time 20
You cant do it alone other HMIS admins contract managers DAC my boss contracts supervisor specific board members infrastructure data posse director other supervisors internal allies external allies
Empowered policy changes Agencies understand own performance System performance understanding System Impact Mostly agitation Project-specific outputs Agencies report in Continuous and transparent Uniform reports, uniform objectives Oversight On-site file audits Waiting around for data Updates and maintenance Canned reports, ad hoc queries Data Stewardship Replicable exports Open Data quality & project performance Communication Focused on expectations How the system functions and reciprocal Project type, population level Are users even logging in? Analysis Project-level, ad hoc System Level Anticipated, but not realized Observe impact of policy changes Value Validation of beliefs Testing of anecdotal theories Non-traditional partners Coverage Limited to the brave or obligated Voluntary Partners Increased proficiency, decreased resistance Participation Resistant More substantial, more nimble Closer to real life data Thin and limited Standards
Decision Points and Opportunities Data Collection Mechanism Extraction Mechanism User Interface Raw Data Tables Interesting stuff happening in the world Export File not ready for analysis Transform Analyze Visualize 24
Practice Connecting to a Data Source page 6 25
Table Joins Inner Left Right Full Outer 26
Practice Joining Tables page 8
Getting to Know Tableau 29
Dimensions Discrete = Categorical, Countable Finite number of values Counted, not measured Examples: Age group at entry Favorite color 30
Measures Continuous infinite number of possible values Quantitative measured, not counted Examples: Age Income Days in Program 31
Practice Altering Data Types page 9 32
Converting Numeric Field to a Measure to a Dimension Changing default formatting String Field
Organizing your workbook Open a search box: Ctrl+f Type: Date While pressing Ctrl, select: EntryDate ExitDate MoveInDate Right click -> Folders -> Create Folder Name it: Enrollment Date Repeat for all other dates, put in new folder MetaData 35
Break Time 36
Data Visualization Opportunity to practice communication skills patience iteration Can you build us a swing? projectcartoon.com
Project Planning Overview Project Plan Your role Accuracy Context Data Source Audience Utility Clarity Timeframe Granularity Interactivity Metrics ^ What s wrong with this visualization? 39
YOUR ROLE Make the dashboard support your stakeholders agenda Leave the summary analysis entirely to the user 1. Make it accurate 2. Make it clear Dashboards allow users to find their own takeaways. Set them up for success. 3. Make it useful It is your job to be the expert. You won t always have the answers, but when you do, share them. Try to prevent inaccurate interpretation. 40
Tell me about this chart Get to the point Color should add meaning just no. 41
Sorted by value Color correlates with meaning Drop meaningless text Too much color 42
All the math in the world cant replace context How were the data collected? How does the quality and accuracy vary throughout the set? Some questions are harder to get accurate answers for Data entry can vary by user and their own value judgments How have the data fields evolved? Understanding and Definition What policy changes have occurred during the lifetime of the data set? Demo: Finding Policy Changes 43
Data Visualization Project Plan Template Stephanie made you all a present. See Attachment A of your manual. PS Stephanie I made some changes. 44
Planning What are you building? Dashboard Single Screen, all in one view Example: https://public.tableau.com/profile/snocohmis#!/vizhome/HeatMapbyAgency/Master Scrollytelling, single screen but additional information as you scroll Example: https://endhomelessness.org/homelessness-in-america/homelessness-statistics/state-of- homelessness-report/ Multi-screen https://public.tableau.com/profile/snocohmis#!/vizhome/SnohomishCountyRapidRehousing/SelectPara meters Delivery Mechanism How often will folks want to print this product? Impacts Interactivity Tooltips 45
Planning The Audience Time to generate and spend social capital 1. Connect 2. Identify shared values 3. Build on what they know Internal External What do they do? Data Team Partner Agencies: - Make decisions - Provide services - Monitor performance - Understand need - Get engaged Contracts Team CoC - Direct Service - Leadership - The Community - Funders Immediate Supervisor Leadership Boss s Boss - Elected Officials
Planning The Utility I want people to Realize how awesome I am >> Be fancy Be better informed >> Be clear and concise Answer their own questions >> Plan for what they want to know Be inspired to ask more questions >> User friendly and interactive Take action >> Be clear about the problem 47
Be Clear About the Problem Overall, the number of households experiencing homelessness was up almost 14% since Q1 of 2017 48
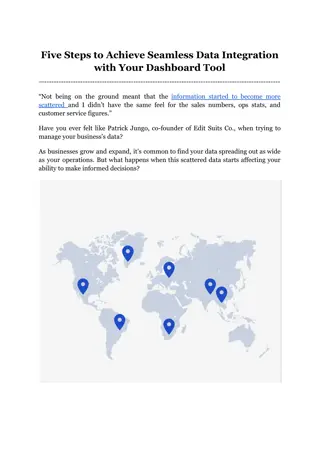
Planning Data Source Do you have a data source identified for this project? How often is it refreshed? Does it need to be altered to meet the need? 49
Pause and reflect How much time will this take to build the first time? How much will it take to refresh? How much documentation is needed? How thoroughly will it meet the need? Is it worth it? 50


")