Data Analysis and Correlation Coefficients in AP Homework Agenda
Explore the homework agenda for an AP course, focusing on data collection, correlation coefficients, and analyzing relationships between variables. Learn about correlation coefficients, make predictions, and guess correlations between various pairs of variables. Get insights on calculating correlation coefficients, using calculators, and identifying associations. Conclude with a fun mystery activity, "Who dun it?".

Download Presentation

Please find below an Image/Link to download the presentation.
The content on the website is provided AS IS for your information and personal use only. It may not be sold, licensed, or shared on other websites without obtaining consent from the author. If you encounter any issues during the download, it is possible that the publisher has removed the file from their server.
You are allowed to download the files provided on this website for personal or commercial use, subject to the condition that they are used lawfully. All files are the property of their respective owners.
The content on the website is provided AS IS for your information and personal use only. It may not be sold, licensed, or shared on other websites without obtaining consent from the author.
E N D
Presentation Transcript
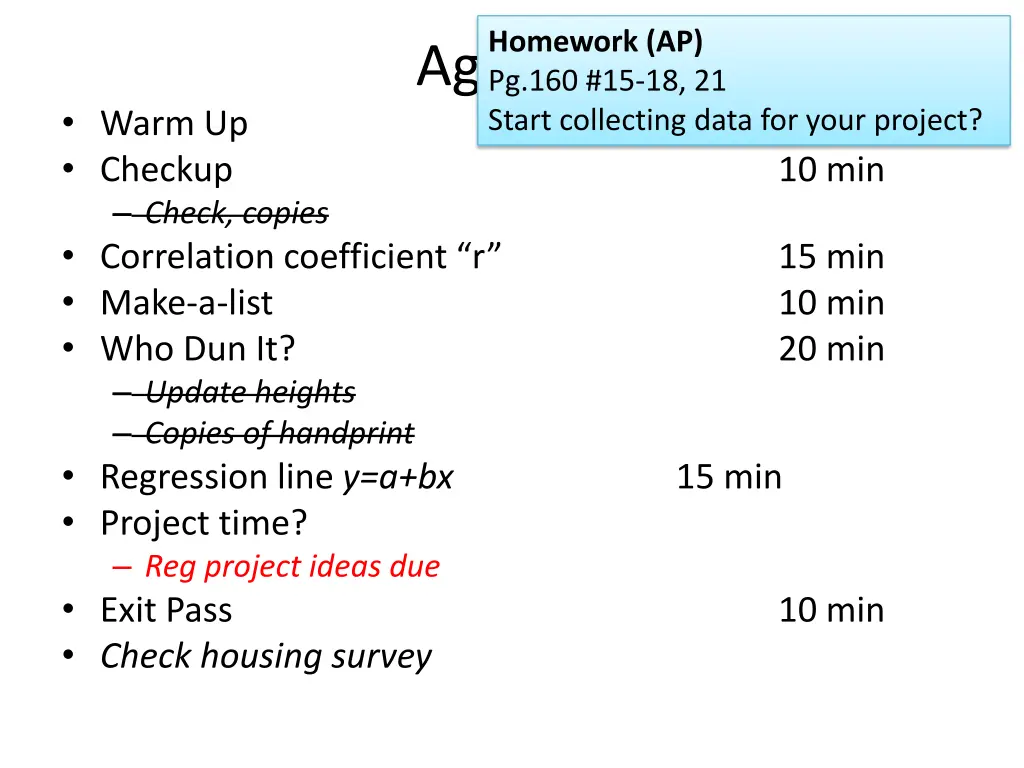
Homework (AP) Agenda Pg.160 #15-18, 21 Start collecting data for your project? Warm Up Checkup Check, copies Correlation coefficient r Make-a-list Who Dun It? Update heights Copies of handprint Regression line y=a+bx Project time? Reg project ideas due Exit Pass Check housing survey 10 min 10 min 15 min 10 min 20 min 15 min 10 min
Warm Up For each of the following, briefly (~5 words) describe the suspected relationship using DFS. Skip context. 1. Age at death and weekly cigarette consumption 2. Distance to destination and cost of flight 3. Number of letters in a person s name and their shoe size 4. Miles driven and price for used cars 5. Price and number of pages of a textbook tinyurl.com/602housesurvey
Notes Correlation coefficient r 1 of 3 Measures the direction and strength of the association between two quantitative variables -1 r 1 -1 Perfect negative 0 No association at all 1 Perfect positive Warnings: Not resistant to outliers. Does not guarantee linearity. Use only with a graph. Does not imply causation.
Window/Door For each of the following pairs of variables, guess the correlation coefficient (r). 1. Age at death and weekly cigarette consumption 2. Distance to destination and cost of flight 3. Number of letters in a person s name and their shoe size 4. Miles driven and price for used cars 5. Price and number of pages of a textbook
Calculating r n 1 = ( ( ) ) z z x y = i r n n x x y y = ( ( ) ) i i s s = 1 i x y r n
Notes Calculators and r 2nd: Catalog: DiagnosticOn (Enter) STAT CALC 4:LinReg(ax+b) 2 of 3 Explanatory Response 1 5 2 6 3 3 3 5 7 1
Make-a-list Pairs of variables with a strong positive association. Pairs of variables with a strong negative association. Pairs of variables with no association.
Goodbye Einstein. Dead. Murdered.
Who dun it? TEACHER Saepan Cole VanBuskirk Frantz Ryan Hook Tan Ceo Hwang Colligan Burton Okita HEIGHT (in.) 67 64 74 70 65 69 61 68.5 61 75.5 64 66
Handspan Height 9.5 8.5 8.5 8.5 8.5 8.5 8.5 8.2 8 8 8 8 Who dun it? (P.1) 70.75 64 68 68 69 66 63 63.25 69 68 70 64 1. Use a calculator to create a scatterplot of this class heights and hand-spans. Interpret with DFS. 8 62 63.5 64 64 66 63 67 66 62 69 66 62 60 7.9 7.5 7.5 7.5 7.5 7 7 7 7 7 7 6 2. Predict the murderer s identity. Justify your answer.
Handspan Height 62 9.25 9 8.75 8.5 8.25 8 8 8 8 8 8 8 8 Who dun it? (P.3) 61.75 73 67 70 68.75 64 63 72 63 61.5 64 68 66 65 1. Use a calculator to create a scatterplot of this class heights and hand-spans. Interpret with DFS. 7.9 7.8 7.75 7.75 7.5 7.5 7.5 7.3 7.3 7 6.5 6.5 6.3 4 64 66 67 66 66 62 67.5 62.5 66.5 64 61 63 70 63 2. Predict the murderer s identity. Justify your answer.
Notes Regression Line ? = ?? + ? 3 of 3 Also called least-squares line , line of best fit Minimizes the sum of the squared deviations of predicted and observed values Describes how a response variable y changes as an explanatory variable x changes Used to predict y, given a value for x Identify x and y!
Slope-Intercept Form! It s y = x+3 slope y-intercept 1/2 3
1. What is slope? 2. What is the y-intercept?
Notes 3 of 3 Regression Line Also called Least-squares line , line of best fit Minimizes the sum of the squared deviations of predicted and observed values Describes how a response variable y changes as an explanatory variable x changes Used to predict y, given a value for x a slope or constant For every 1 [x], [y] goes up by _____. b y-intercept or amount When [x] is 0, [y] is ______. EXAMPLE. Handspan and height (Geogebra) ? = ?? + ? Identify x and y!
P.1 y = 1.81x + 51.44
P.3 y = 2.5x + 45.92
Who dun it? TEACHER Saepan Cole VanBuskirk Frantz Ryan Hook Tan Ceo Hwang Colligan Burton Okita HEIGHT (in.) 67 64 74 70 65 69 61 68.5 61 75.5 64 66
All students y = 2.81x + 43.75
Who dun it? TEACHER Saepan Cole VanBuskirk Frantz Ryan Hook Tan Ceo Hwang Colligan Burton Okita HEIGHT (in.) 67 64 74 70 65 69 61 68.5 61 75.5 64 66
Window/Door Briefly describe what the slope and y-intercept mean in context. 1. On your recent Unit 2 test, the relationship between your expected and actual scores was y = 0.5781x + 11.007, where expected scores is your explanatory variable. 2. From your survey data, the relationship between hours of sleep and GPA is y = -0.0028x + 3.6526, where sleep is your explanatory variable. 3. From your survey, the relationship between the hours you spent on a computer the last day of summer, and average hours studying per week, is y = 0.4897x + 5.6385, where hours on computer is the explanatory variable. 4. In 2012, the relationship between birth and death rates per 1000 people in all fifty US states was y = -0.3362x + 13.1295, where birth rates is the explanatory variable.
Project time? Read the Project #2 handout. Ask me questions as needed. Choose your topic. Decide what your two quantitative variables are going to be. Plan to collect data this weekend.
Homework (AP) Pg.160 #15-18, 21 Start collecting data for your project? Exit Pass 1. Construct a scatterplot of the data below. 2. Interpret the scatterplot. SAT Math SAT Writing 700 720 700 650 600 600 660 610 500 550 600 690 730 680 540 570 tinyurl.com/602housesurvey
")


")