Data Analysis and Statistics: Recognizing Distributions
In this educational material, you will explore topics such as populations vs. samples, distinguishing parameters from statistics, and understanding normal distributions. Learn how to identify populations and samples, differentiate parameters from statistics, and grasp the concepts through visual aids and explanations.
Download Presentation

Please find below an Image/Link to download the presentation.
The content on the website is provided AS IS for your information and personal use only. It may not be sold, licensed, or shared on other websites without obtaining consent from the author.If you encounter any issues during the download, it is possible that the publisher has removed the file from their server.
You are allowed to download the files provided on this website for personal or commercial use, subject to the condition that they are used lawfully. All files are the property of their respective owners.
The content on the website is provided AS IS for your information and personal use only. It may not be sold, licensed, or shared on other websites without obtaining consent from the author.
E N D
Presentation Transcript
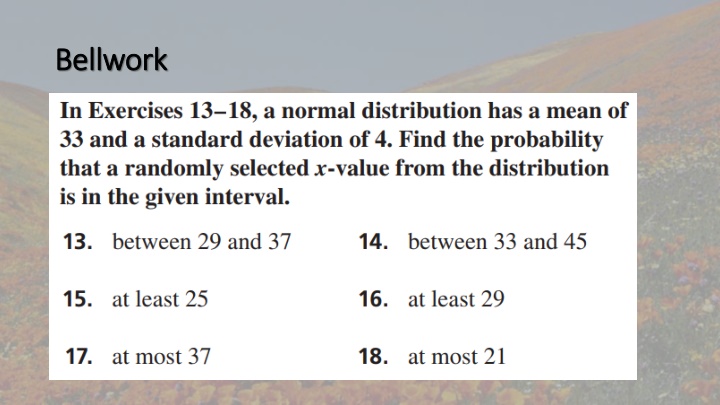
Bellwork Bellwork
Data Analysis and Statistics Chapter 11
Recognizing Normal Distributions Recognizing Normal Distributions (Review) (Review)
You Try You Try
Populations and Samples Populations and Samples A population is the collection of all data, such as responses, measurements, or counts, that you want information about. A sample is a subset of a population.
Identify Identify the population and the sample. the population and the sample. 1. To estimate the retail prices for three grades of gasoline sold in the United States, the Energy Information Association calls 800 retail gasoline outlets, records the prices, and then determines the average price for each grade. 2. A survey of 4464 shoppers in the United States found that they spent an average of $407.02 from Thursday through Sunday during a recent Thanksgiving holiday. 3. A survey found that the median salary of 1068 statisticians is about $72,800. Is the median salary a parameter or a statistic? Explain your reasoning. 4. The mean age of U.S. representatives at the start of the 113th Congress was about 57 years. Is the mean age a parameter or a statistic? Explain your reasoning.
Take Notes Parameter: A numerical description of a population characteristic is called a parameter. Statistic: A numerical description of a sample characteristic is called a statistic. Because some populations are too large to measure, a statistic, such as the sample mean, is used to estimate the parameter, such as the population mean. It is important that you are able to distinguish between a parameter and a statistic.
Distinguishing Between Parameters and Distinguishing Between Parameters and Statistics Statistics a. For all students taking the SAT in a recent year, the mean mathematics score was 514. Is the mean score a parameter or a statistic? Explain your reasoning. b. A survey of 1060 women, ages 20 29 in the United States, found that the standard deviation of their heights is about 2.6 inches. Is the standard deviation of the heights a parameter or a statistic? Explain your reasoning.
Identifying Sampling Methods in Statistical Studies (Take Note)
Recognizing Bias in Sampling Recognizing Bias in Sampling A bias is an error that results in a misrepresentation of a population. In order to obtain reliable information and draw accurate conclusions about a population, it is important to select an unbiased sample. An unbiased sample is representative of the population that you want information about. A sample that over represents or under-represents part of the population is a biased sample. When a sample is biased, the data are invalid. A random sample can help reduce the possibility of a biased sample.
Take Take Note Note
Bellwork Identify the population and sample. Describe the sample. 1. In the United States, a survey of 1152 adults ages 18 and over found that 403 of them pretend to use their smartphones to avoid talking to someone. 2. In the United States, a survey of 2000 households with at least one child found that 1280 of them eat dinner together every night. Determine whether the numerical value is a parameter or a statistic. Explain your reasoning. 3. In a recent year, 53% of the senators in the United States Senate were Democrats. 4. The average annual salary of some physical therapists in a state is $76,210.
Estimating Population Parameters (Take notes on the definition of descriptive and Inferential Stat.) The study of statistics has two major branches: descriptive statistics and inferential statistics. Descriptive statistics involves the organization, summarization, and display of data. So far, you have been using descriptive statistics in your studies of data analysis and statistics. Inferential statistics involves using a sample to draw conclusions about a population. You can use statistics to make reasonable predictions, or inferences, about an entire population when the sample is representative of the population.
Finding Margins of Error for Surveys When conducting a survey, you need to make the size of your sample large enough so that it accurately represents the population. As the sample size increases, the margin of error decreases. The margin of error gives a limit on how much the responses of the sample would differ from the responses of the population. For example, if 40% of the people in a poll favor a new tax law, and the margin of error is 4%, then it is likely that between 36% and 44% of the entire population favor a new tax law.
