Data Analysis in Geophysics with Dr. Robert Smalley
Data analysis in geophysics involves obtaining and analyzing seismic data. Dr. Robert Smalley provides guidance on where to access data programmatically from various sources. Learn how to get stations operational during earthquakes of interest, such as the Maule earthquake in Chile in 2010. Explore different networks and stations available for study."

Download Presentation

Please find below an Image/Link to download the presentation.
The content on the website is provided AS IS for your information and personal use only. It may not be sold, licensed, or shared on other websites without obtaining consent from the author.If you encounter any issues during the download, it is possible that the publisher has removed the file from their server.
You are allowed to download the files provided on this website for personal or commercial use, subject to the condition that they are used lawfully. All files are the property of their respective owners.
The content on the website is provided AS IS for your information and personal use only. It may not be sold, licensed, or shared on other websites without obtaining consent from the author.
E N D
Presentation Transcript
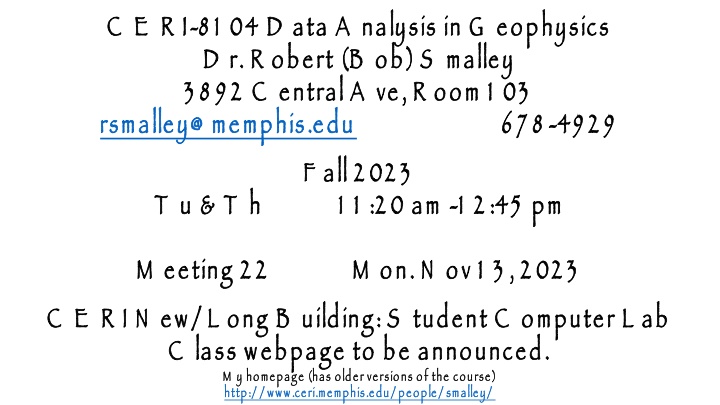
C E R I- -8 1 04 D ata A nalysis in G eophysics D r. R obert (B ob) S malley 3 8 9 2 C entral A ve, R oom 1 03 rsmalley@ memphis.edu F all 2 02 3 T u & T h 1 1 :2 0 am 8 1 04 D ata A nalysis in G eophysics D r. R obert (B ob) S malley 3 8 9 2 C entral A ve, R oom 1 03 rsmalley@ memphis.edu F all 2 02 3 T u & T h 1 1 :2 0 am - -1 2 :45 pm C E R I 6 7 8 6 7 8 - -49 2 9 49 2 9 1 2 :45 pm M eeting 2 2 M eeting 2 2 M on. N ov 1 3 , 2 02 3 M on. N ov 1 3 , 2 02 3 C E R I N ew/ L ong B uilding: S tudent C omputer L ab C lass webpage to be announced. M y homepage (has older versions of the course) http:/ / www.ceri.memphis.edu/ people/ smalley/ C E R I N ew/ L ong B uilding: S tudent C omputer L ab C lass webpage to be announced. M y homepage (has older versions of the course) http:/ / www.ceri.memphis.edu/ people/ smalley/
C ontinuing with where to get data https:/ / C ontinuing with where to get data programmatically https:/ / docs.obspy.org programmatically obspy.clients.fdsn.html docs.obspy.org/ packages/ / packages/ obspy.clients.fdsn.html from obspy.clients.fdsn.header import URL_MAPPINGS for key in sorted(URL_MAPPINGS.keys()): print("{0:<11} {1}".format(key, URL_MAPPINGS[key])) AUSPASS http://auspass.edu.au BGR http://eida.bgr.de EIDA http://eida-federator.ethz.ch EMSC http://www.seismicportal.eu ETH http://eida.ethz.ch GEOFON http://geofon.gfz-potsdam.de GEONET http://service.geonet.org.nz GFZ http://geofon.gfz-potsdam.de ICGC http://ws.icgc.cat IESDMC http://batsws.earth.sinica.edu.tw INGV http://webservices.ingv.it IPGP http://ws.ipgp.fr IRIS http://service.iris.edu IRISPH5 http://service.iris.edu ISC http://isc-mirror.iris.washington.edu KNMI http://rdsa.knmi.nl KOERI http://eida.koeri.boun.edu.tr LMU http://erde.geophysik.uni-muenchen.de NCEDC https://service.ncedc.org NIEP http://eida-sc3.infp.ro NOA http://eida.gein.noa.gr ODC http://www.orfeus-eu.org ORFEUS http://www.orfeus-eu.org RASPISHAKE https://fdsnws.raspberryshakedata.com RESIF http://ws.resif.fr RESIFPH5 http://ph5ws.resif.fr SCEDC http://service.scedc.caltech.edu TEXNET http://rtserve.beg.utexas.edu UIB-NORSAR http://eida.geo.uib.no USGS http://earthquake.usgs.gov USP http://sismo.iag.usp.br
G etting stations that may be operational during earthquake of interest (here M aule, C hile, M 8 .8 , 2 01 0 https://docs.obspy.org/packages/autogen/obspy.clients.fdsn.client.Client.get_stations.html G etting stations that may be operational during earthquake of interest (here M aule, C hile, M 8 .8 , 2 01 0- -02 02 - -2 7 06 :3 4:1 3 U T C ) 2 7 06 :3 4:1 3 U T C ) from obspy import UTCDateTime from obspy.clients.fdsn import Client client = Client() starttime = UTCDateTime("2010-02-27T00:00:00") endtime = UTCDateTime("2010-02-27T23:59:59") inventory = client.get_stations(network="IU", station="C*", starttime=starttime, endtime=endtime)
G etting stations that may be operational during earthquake of interest (here M aule, C hile, M 8 .8 , 2 01 0 https://docs.obspy.org/packages/autogen/obspy.clients.fdsn.client.Client.get_stations.html G etting stations that may be operational during earthquake of interest (here M aule, C hile, M 8 .8 , 2 01 0- -02 02 - -2 7 06 :3 4:1 3 U T C ) 2 7 06 :3 4:1 3 U T C ) print(inventory) Inventory created at 2023-11-13T16:00:10.634700Z Created by: IRIS WEB SERVICE: fdsnws-station | version: 1.1.52 http://service.iris.edu/fdsnws/station/1/query?starttime=2010-02-... Sending institution: IRIS-DMC (IRIS-DMC) Contains: Networks (1): IU Stations (6): IU.CASY (Casey, Antarctica) IU.CCM (Cathedral Cave, Missouri, USA) IU.CHTO (Chiang Mai, Thailand) IU.COLA (College Outpost, Alaska, USA) IU.COR (Corvallis, Oregon, USA) IU.CTAO (Charters Towers, Australia) Channels (0):) #shows CCM as being operational during Maule eq, but it is NOT, #Wilber search at SAGE/IRIS offers CCM but comes up with NO DATA
G etting stations that may be operational during earthquake of interest (here M aule, C hile, M 8 .8 , 2 01 0 https://docs.obspy.org/packages/autogen/obspy.clients.fdsn.client.Client.get_stations.html G etting stations that may be operational during earthquake of interest (here M aule, C hile, M 8 .8 , 2 01 0- -02 02 - -2 7 06 :3 4:1 3 U T C ) 2 7 06 :3 4:1 3 U T C ) inventory.plot(outfile="MauleStnCxxList.ps") #shows CCM as being operational during Maule eq, but it is NOT, #Wilber search at SAGE/IRIS offers CCM but comes up with NO DATA M akes map M akes map
G et data from IR IS , plot velocity seismogram, remove instrument response, plot displacement seismogram G et data from IR IS , plot velocity seismogram, remove instrument response, plot displacement seismogram """ modified from https://docs.obspy.org/packages/autogen/obspy.clients.fdsn.client.Client.get_waveforms.html """ from obspy.clients.fdsn import Client from obspy import UTCDateTime t = UTCDateTime("2012-12-14T10:36:01.6Z") st3 = client.get_waveforms("TA", "E42A", "*", "BH?", t+300, t+400,attach_response=True) st3.plot() st3.remove_response(output="DISP") #exmple has VEL, but is vel seismogram!!! no change st3.plot() st3.plot(outfile="displacement seismogram.ps")
V elocity seismogram (left) D isplacement seismogram (right)
A nother example, this time surface waves A nother example, this time surface waves from obspy import UTCDateTime from obspy.clients.fdsn import Client client = Client() #t = UTCDateTime("1991-10-19T21:23:14") #event time, this for whole event #drn=120 #duration in minutes t = UTCDateTime("1991-10-19T22:12:00") #rayleigh wave only drn=25 #duration in minutes st = client.get_waveforms("IU", "CCM","*" , "BHZ", t, t + drn * 60, attach_response=True) st.plot() st.plot(outfile="india velocity seismogram.png") st_irr=st.copy() #instrument response is done "in-place", trashes original, make copy st_irr.remove_response(output="DISP") st_irr.plot() st_irr.plot(outfile="india displacement seismogram.png")
V elocity seismogram D isplacement seismogram
https://dobspy.clients.fdsn - FDSN web service client for ObsPyocs.obspy.org/packages/obspy.clients.fdsn.html obspy.clients.fdsn.client.Client.get_stations obspy.clients.fdsn.client.Client.get_waveforms obspy.core.stream.Stream.trim obspy.core.stream.Stream.detrend https://docs.obspy.org/packages/autogen/obspy.core.trace.Trace.remove_response.html obspy.core.stream.Stream.rotate
E arthquake in N . India along H imalayan front recorded at broadband station C C M in M issouri ~1 00 azimuth of ~N (1 0 it is naturally polarized. E arthquake in N . India along H imalayan front recorded at broadband station C C M in M issouri ~1 00 distant with a back azimuth of ~N (1 0 off) so it is naturally polarized. distant with a back off) so P ath is mostly continental showing continental R ayleigh and L ove wave dispersion. P ath is mostly continental showing continental R ayleigh and L ove wave dispersion.
Z oom (trim) into the section with the R ayleigh wave Z oom (trim) into the section with the R ayleigh wave
S light improvement after rotation to great circle back azimuth. S light improvement after rotation to great circle back azimuth.
R emoval of instrument response to displacement. R emoval of instrument response to displacement. N eeds "tweaking" N eeds "tweaking" V ertical is O K , horizontals (typically) need some form of drift correction (long period oscillations on R and T look correlated, and inconsistent with polarization directions, suggesting they are not from the earthquake) V ertical is O K , horizontals (typically) need some form of drift correction (long period oscillations on R and T look correlated, and inconsistent with polarization directions, suggesting they are not from the earthquake)
R adial (x) vs V ertical (y) showing 9 0 shift between them in the retrograde elliptical particle motion of R ayleigh waves. R adial (x) vs V ertical (y) showing 9 0 shift between them in the retrograde elliptical particle motion of R ayleigh waves.
E lliptical particle motion of R ayleigh wave. E lliptical particle motion of R ayleigh wave. P attern starts in the center (small signal before arrival of R ayleigh wave) and returns to center (back to where started after passage of surface wave permanently displace the medium in which they travel) P attern starts in the center (small signal before arrival of R ayleigh wave) and returns to center (back to where started after passage of surface wave waves do not permanently displace the medium in which they travel) waves do not
S ame plot with color added to show the time evolution. S ame plot with color added to show the time evolution. C an see it grow out of center and return. C an see it grow out of center and return.
U sing the time to add a third dimension to see time evolution of the signal. U sing the time to add a third dimension to see time evolution of the signal.
V iew from different angle to see return to center. V iew from different angle to see return to center. N eeds the color also. N eeds the color also. T his and last image show some problems with python labeling. N ot as professional as G M T . T his and last image show some problems with python labeling. N ot as professional as G M T .


")


 into the")


 vs")