Data Analysis Using TDA Mapper - Exploring Filters and Results
Use of TDA Mapper to analyze datasets, focusing on different filters like PCA, distance matrix eigenvectors, and kNN. Understand how varying intervals affect cluster detection and learn from the analysis of clustering results.

Download Presentation

Please find below an Image/Link to download the presentation.
The content on the website is provided AS IS for your information and personal use only. It may not be sold, licensed, or shared on other websites without obtaining consent from the author.If you encounter any issues during the download, it is possible that the publisher has removed the file from their server.
You are allowed to download the files provided on this website for personal or commercial use, subject to the condition that they are used lawfully. All files are the property of their respective owners.
The content on the website is provided AS IS for your information and personal use only. It may not be sold, licensed, or shared on other websites without obtaining consent from the author.
E N D
Presentation Transcript
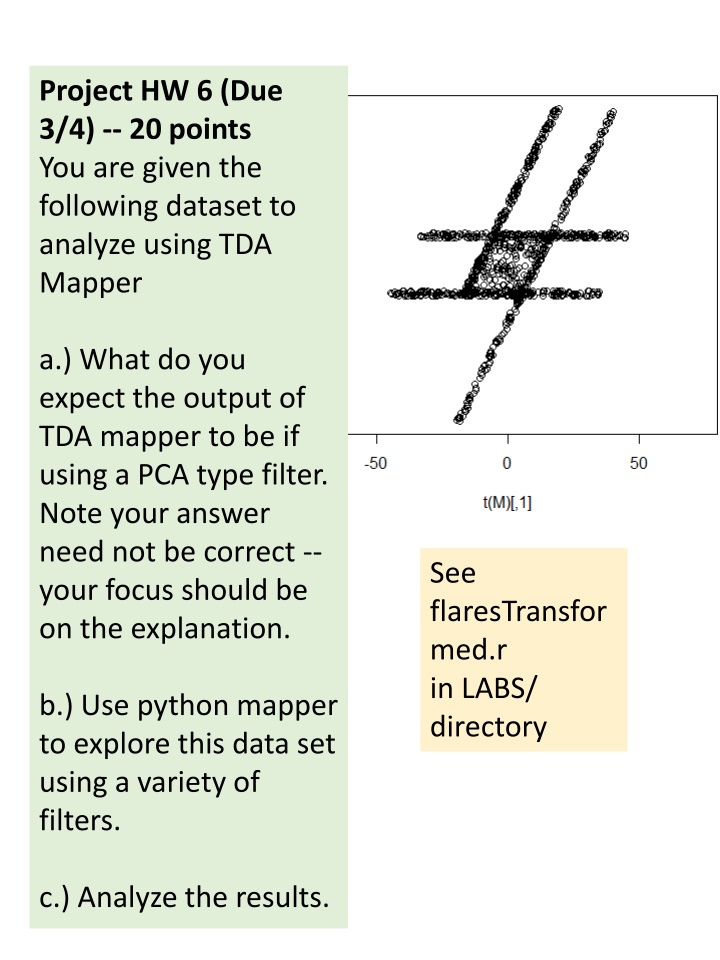
Project HW 6 (Due 3/4) -- 20 points You are given the following dataset to analyze using TDA Mapper a.) What do you expect the output of TDA mapper to be if using a PCA type filter. Note your answer need not be correct -- your focus should be on the explanation. See flaresTransfor med.r in LABS/ directory b.) Use python mapper to explore this data set using a variety of filters. c.) Analyze the results.
a.) The figure on the right was created using python mapper. The chosen filter was distance matrix eigenvector with mean centered distance matrix and order of eigenvector = 0. The data points are colored using their filter value. For simplicity, I will use 5 overlapping bins with 50% overlap as shown in the figure on the right (also see figures on next page). Note the red line indicates the first principle component axis (i.e. direction of eigenvector with largest eigenvalue for the covariance matrix). Thus the overlapping bins are perpendicular to this line.
My expectation regarding output of TDA mapper This orange bin contains 1 cluster. The red bin contains 3 cluster. This green bin contains 2 cluster. This yellow bin contains 1 cluster. If my assumptions regarding number of clusters is correct, then the output of mapper should be This blue bin contains 2 cluster.
a & c.) If my assumptions regarding number of clusters is correct, then the output of mapper should be the figure to the right: Or equivalently (same graph, just drawn differently): The actual output of python mapper is shown below: It appears there may have been 2 blue clusters: 84 + 135 (thus my blue bin may have been a little off). 2 green cluster: 274 + 16 1 yellow cluster : 386 1 orange clusters : 447 2 red clusters : 354 + 41 (thus my red bin may have been a little off).
b & c.) Mapper output for different numbers of intervals 3 intervals 4 intervals 10 intervals 5 intervals Thus it appears that 3 or 4 overlapping bins is too few (as these outputs are different from the other outputs though 4 is not that different from 5). 20 intervals Note the similarity in shape between the output for 10 and 20 overlapping bins.
Mapper output with different filters Eccentricity (infinity) kNN where k = 300 Note k = 300 was chosen based on visualizing the data set (which is not possible when dim > 3) 5 intervals 5 intervals 10 intervals 10 intervals 20 intervals 20 intervals

 The figure on the right was")

 If my assumptions regarding")
 Mapper output for different numbers of intervals")