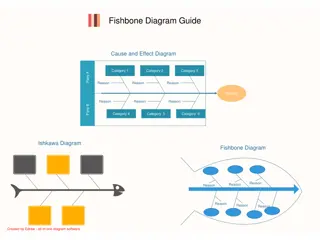
DATA FLOW DIAGRAM
A Data Flow Diagram (DFD) is a graphical representation of how data flows through a computer system. It illustrates the flow of data from source to destination and where it is stored, providing an overview of what data a system processes, transformations performed, data stored, and results produced. DFD serves as a communication tool between users, analysts, and system designers. It categorizes DFD as logical or physical, focusing on business operations and system implementation, respectively. Elements of DFD include external entities, data flows, processes, and data stores. These diagrams help in understanding the flow of data without detailing processing timing.

Download Presentation

Please find below an Image/Link to download the presentation.
The content on the website is provided AS IS for your information and personal use only. It may not be sold, licensed, or shared on other websites without obtaining consent from the author.If you encounter any issues during the download, it is possible that the publisher has removed the file from their server.
You are allowed to download the files provided on this website for personal or commercial use, subject to the condition that they are used lawfully. All files are the property of their respective owners.
The content on the website is provided AS IS for your information and personal use only. It may not be sold, licensed, or shared on other websites without obtaining consent from the author.
E N D
Presentation Transcript
DEFINITION A data flow diagram (DFD) is a graphical representation of the "flow" of data through a computer system. OR A data flow diagram looks at how data flows through a system. It concerns things like where the data will come from and go to as well as where it will be stored. But you won't find information about the processing timing (e.g. whether the processes happen in sequence or in parallel).
Why DFD Provides an overview of- What data a system processes What transformations are performed What data are stored What results are produced and where they flow Graphical nature makes it a good communication tool between- User and analyst Analyst and System designer
DFD is not a flow chart Flow chart shows flow of Control . DFD shows flow of Data The flowchart describes boxes that describe computations, decisions, interactions & loops. It is important to keep in mind that data flow diagrams are not flowcharts and should not include control elements .
TYPES OF DFD Data flow diagrams (DFDs) are categorized as either logical or physical. 1) LOGICAL DFD:-A logical DFD focuses on the business and how the business operates. It describes the business events that take place and the data required and produced by each event. 2) PHYSICAL DFD:-A physical DFD shows how the system will be implemented.
Elements of DFD Source/Sinks (External entities) Data flows Processes Data Stores
External Entities External Entities: External Entities A Rectangle represents an external entity They either supply or receive data Source Entity that supplies data to the system. Sink Entity that receives data from the system. They do not process data
ENTITIES Doctor Student Cashier Teacher Manager User Customer
2) Process:- A circle represents a process Straight line with incoming arrows are input data flows Straight lines with outgoing arrows are output data flows Labels are assigned to Data flow. These aid documentation Delivery Slip Stores demand note 1. STORES Issue Slip
Processes Grading System Accounting System Reservation System Patient Administration System Marketing System
3) Data Store:- Opened sided rectangles in DFD indicates data store. Opened sided rectangles in DFD indicates data store. The Data Store symbol represents data that is not moving The Data Store symbol represents data that is not moving (delayed data at rest). (delayed data at rest). A Data Store is a repository of data. A Data Store is a repository of data. Data can be written into the data store. This is depicted by Data can be written into the data store. This is depicted by an incoming arrow. an incoming arrow. Two data stores cannot be connected by a data Two data stores cannot be connected by a data flow. flow.
Data can be read from a data store. This is depicted by an outgoing arrow. External entity cannot read or write to the data store.
4) Data Flow:- Arrow symbol in DFD indicate data flow Arrow symbol in DFD indicate data flow The Data Flow symbol represents movement of data The Data Flow symbol represents movement of data
RULES OF DATA FLOW Data can flow from Data can flow from -external entity to process -process to external entity -process to store and back -process to process Data cannot flow from Data cannot flow from -external entity to external entity -external entity to store -store to external entity -store to store
EXAMPLE 1 This diagram represents a banking process, which maintains customer accounts. In In this cash, cash, request update update their this example, example, customers request information their account account details customers can information about details. . can withdraw withdraw or or deposit about their their account deposit account or or The The five represent represent the any any business business process five different different symbols the full process diagram symbols used full set set of of symbols diagram. . used in in this symbols required this example example required to to draw draw
LEVELS OF DFD Level 0 DFD Level 0 DFD The level 0 DFD (also known as the context level DFD ) is the simplest DFD. The outermost level (Level 0) is concerned with how the system interacts with the outside world. This level basically represents the input and output of the entire system.
How to create Level 0 DFD 1. Identify your main system 2. Identify the external people who interact with the system 3. Decide what data these entities will enter into the system 4. Determine what these entities expect as output from the system
Context Level DFD for a Mail Order Business ORDER CUSTOMER ORDER PROCESSING DELIVERY
Level 1 DFD The basic module of the system are represented in this phase and how data moves through different module is shown. The level 1 DFD provides a high level view of the system that identifies the major processes and data stores.
How to create Level 1 DFD 1. 1. Focus Focus on on your your process process and and break break it it into into 2 2 or or more more sub sub- - processes processes 2. 2. Identify Identify what what data data flows flows between between these these processes processes and and between between the the entities entities 3. 3. Identify Identify What What permanent permanent data data files files are are used used in in this this system system 4. 4. Note Note that that no no new new entities entities can can be be introduced introduced
Level 1 DFD for a Mail Order Business Order SALES PROCESSING CUSTOMER Delivery Credit Order Status Order CUSTOMER DATABASE Credit Status ORDERS ACCOUNTING SYSTEM Customer no.
2-Level DFD and other level of DFD Each process from level 1 is exploded even more into sub processes. This decomposition continues for each level. The number of levels possible depends on the complexity of the system
LEVELLING DFD A context diagram is expanded into a number of inter- related processes. Each process may be further expanded into a set of inter-connected sub processes. This procedure of expanding a DFD is known as leveling.
The value of a DFD With a dataflow diagram, users are able to visualize how the system will operate, what the system will accomplish, and how the system will be implemented Data flow diagrams can be used to provide the end user with physical idea of how the data they input ultimately has an effect upon the structure of the whole system. The old system s dataflow diagrams can also be drawn up and compared with the new system s dataflow diagrams to draw comparisons in order to help implement a more efficient system. 1. 2. 3.
1) In a DFD external entities are represented by a______ a. Rectangle b. Ellipse c. diamond shaped box d. Circle A 2) External Entities may be a_________ a. source of input data only b. source of input data or destination of results c. destination of results only d. repository of data B
3) A data store in a DFD represents a. a sequential file b. a disk store c. a repository of data d. a random access memory C 4) A data cannot flow between a store and (i) a store (ii)a process (iii)an external entity a. i and iii b. i and ii c. ii and iii d. ii A
5) Data cannot flow from an external entity to an external entity because a. it will get corrupted b. it is not allowed in DFD c. an external entity has no mechanism to read or write d. both are outside the context of the system D 6) A data flow can a. only enter a data store b. only leave a data store c. enter or leave a data store d. either enter or leave a data store but not both C
7) The following portion of a DFD is not correct as a. there is no output data flow from the process b. there are three data flow inputs to the process c. there is no external entity d. there is no data store Quantity Quantity Cost/unit Billing Process Process Billing Discount Discount A
8) The following portion of a DFD is not correct as (a) there are many data flows out of the process (b) there are no input data flows to the process (c) the output does not go to an external entity (d) there is no data store Order to vendor Out of stock Billing Proces Too much stock B
9) A context diagram a. describes the context of a system b. is a DFD which gives an overview of the system c. is a detailed description of a system d. is not used in drawing a detailed DFD B B 10) By leveling a DFD we mean a. splitting it into different levels a. splitting it into different levels b. make its structure uniform b. make its structure uniform c. expanding a process into one with more sub c. expanding a process into one with more sub- -processes giving more detail detail processes giving more d. summarizing a DFD to specify only the essentials d. summarizing a DFD to specify only the essentials C
11 ) A physical DFD specifies a. what processes will be used b. who generates data and who processes it c. what each person in an organization does d. which data will be generated B 12) Data flow in a DFD must have (i) an arrow showing direction of flow of data (ii)a meaningful name (iii)a label such as: xyz (iv)no arrows as they are confusing a. a. i i and iii and iii b. ii and iv b. ii and iv c. iii and iv c. iii and iv A
Your Assignment A A general general DFD DFD for for an an airline airline reservation reservation system system
References http://en.wikipedia.org/wiki/Physical_Data_Flow http://www.visual-paradigm.com/product/bpva/tutorials/dfd.jsp http://www.civil.utm.my/staff/file/141/file/CIMLectureNotes2011.pdf http://spot.colorado.edu/~kozar/DFDtechnique.html http://www.fbk.eur.nl/PRJ/MEETEYEES/dfd.htm Http://ratandon.mysite.syr.edu/cis453/notes/DFD_over_Flowcharts. pdf http://www.slideshare.net/mohit4192/dfd-examples http://ecourses.vtu.ac.in/nptel/courses/Webcoursecontents/IIScBAN G/System%20Analysis%20and%20Design/pdf/module5.pdf
Submitted by Nidhi Sharma 8503


 Process:-")

 Data Store:-")


 Data Flow:-")


 In a DFD external entities are represented by a______")
 A data store in a DFD represents")
 Data cannot flow from an external entity to an external")
 The following portion of a DFD is not correct as")
 The following portion of a DFD is not correct as")
 A context diagram")
 A physical DFD specifies")