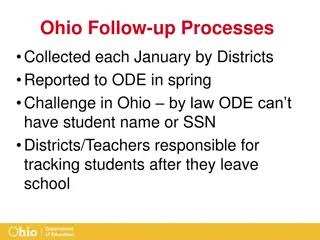
Data Follow Up

The data presents the historic annual student headcount at Silicon Valley colleges from 1993 to 2021, sourced from CCCCO Datamart. It also includes population demographics of San Jose, Santa Clara County, and California, highlighting statistics such as population, ethnicity, per capita income, poverty rates, and more. The visuals provide an insightful overview of educational and population trends in the region.

Download Presentation

Please find below an Image/Link to download the presentation.
The content on the website is provided AS IS for your information and personal use only. It may not be sold, licensed, or shared on other websites without obtaining consent from the author.If you encounter any issues during the download, it is possible that the publisher has removed the file from their server.
You are allowed to download the files provided on this website for personal or commercial use, subject to the condition that they are used lawfully. All files are the property of their respective owners.
The content on the website is provided AS IS for your information and personal use only. It may not be sold, licensed, or shared on other websites without obtaining consent from the author.
E N D
Presentation Transcript
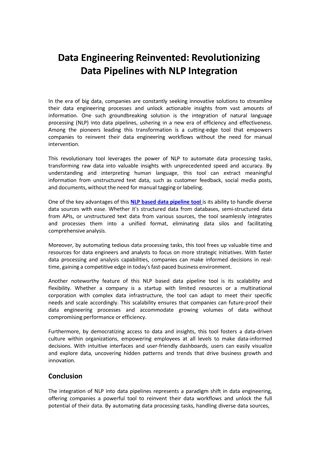
Historic Annual Student Headcount Silicon Valley Colleges, 1993-2021 Source: CCCCO Datamart 50,000 45,000 40,000 35,000 30,000 25,000 20,000 15,000 10,000 5,000 0 Deanza Evergreen Valley Foothill Gavilan Mission San Jose City West Valley
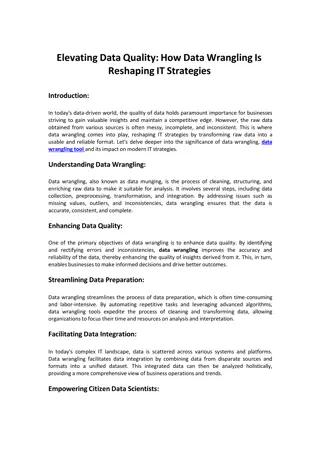
Source: CCCCO DataMart 16,000 Historic Term Headcount Evergreen Valley College, 1992-2021 14,000 12,000 10,000 8,000 6,000 4,000 2,000 0 1992 1993 1994 1995 1996 1997 1998 1999 2000 2001 2002 2003 2004 2005 2006 2007 2008 2009 2010 2011 2012 2013 2014 2015 2016 2017 2018 2019 2020 2021 Summer Fall Spring
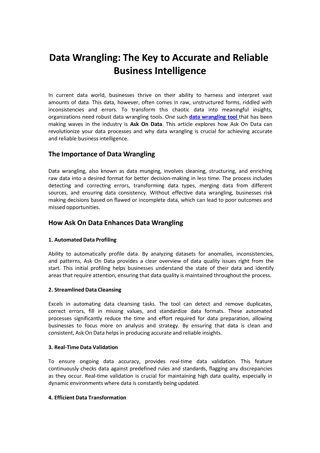
San Jose Santa Clara County California USA Population 2019 1 million 1.9 million 39 million 328 million Under 5 6.1% 5.8% 6.0% 6.0% Under 18 22.4% 21.6% 22.5% 22.3% Over 65 12.5% 13.9% 14.8% 16.5% Comparative Demographics, 2019 estimates US Census Data White (not Latinx) 25.7% 30.6% 36.5% 60.1% Asian 35.9% 39.0% 15.5% 5.9% Latinx 31.6% 25.0% 39.4% 18.5% Foreign Born 39.7% 39.2% 26.8% 13.6% Language other than Engl @home 57.2% 53.0% 44.2% 21.6%
Comparative Demographics, 2019 estimates US Census Data San Jose Santa Clara County California USA Persons per household 3.12 2.95 2.95 2.62 Per capita income $46,599 $56,248 $36,955 $34,103 In poverty 8.7% 6.1% 11.8% 11.4% Median gross rent $2,107 $2,268 $1,503 $1,062 BA+ 43.7% 52.4% 33.9% 32.1% Households w/computer 95.2% 96.0% 93.0% 90.3% w/broadband internet 91.2% 91.8% 86.7% 82.7%
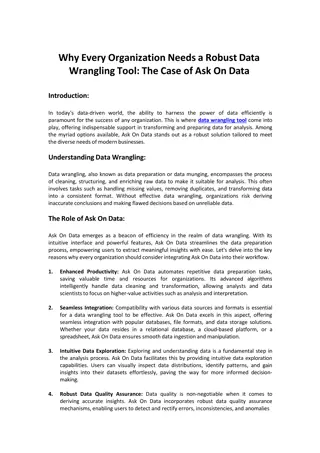
Population and Projections Population and Projections Santa Clara County, 2010 Santa Clara County, 2010- -2060 2060 2,750,000 Source: California Department of Finance 2,500,000 2,250,000 2,000,000 1,750,000 1,500,000 1,250,000 1,000,000 750,000 500,000 250,000 0 2010 2015 2020 2025 2030 2035 2040 2045 2050 2055 2060 0-9 10-19 20-29 30-39 40-49 50-59 60-69 70-79 80-89 90-99 100+
Population and Projections by Ethnicity Population and Projections by Ethnicity Santa Clara County, 2010 Santa Clara County, 2010- -2060 2060 2,500,000 Source: California Department of Finance 2,000,000 1,500,000 1,000,000 500,000 0 2010 2015 2020 2025 2030 2035 2040 2045 2050 2055 2060 White (NH) Asian (NH) Hispanic (any race) Native Hawaiian or Pacific Islander (NH) American Indian or Alaska Native (NH) Black (NH) Multiracial (NH)
(Extrapolated from CDE DataQuest data) 22,500 20,000 12th Grade Enrollment Projections 17,500 15,000 Santa Clara County Public Schools 12,500 10,000 7,500 5,000 2,500 0 2021 2022 2023 2024 2025 2026 2027 2028 2029 2030 2031 2032 2033
Percent of Recent High School Graduates Enrolling at EVC
Questions? Comments?


")