Data Package for HyMAX Krishna Talluru, Liam McQuellin & Andrew Neely Hypersonics Group UNSW Canberra
"Explore the data package for HyMAX featuring input data, geometry details, sensor locations, sample results, and schlieren visualization for hypersonic research conducted by Krishna Talluru, Liam McQuellin & Andrew Neely at UNSW Canberra. The package includes information on test conditions, facility operation, sensor data sets, and analytical findings to enhance understanding of hypersonics. Contact k.talluru@adfa.edu.au for correspondence." (312 characters)
Download Presentation

Please find below an Image/Link to download the presentation.
The content on the website is provided AS IS for your information and personal use only. It may not be sold, licensed, or shared on other websites without obtaining consent from the author. If you encounter any issues during the download, it is possible that the publisher has removed the file from their server.
You are allowed to download the files provided on this website for personal or commercial use, subject to the condition that they are used lawfully. All files are the property of their respective owners.
The content on the website is provided AS IS for your information and personal use only. It may not be sold, licensed, or shared on other websites without obtaining consent from the author.
E N D
Presentation Transcript
Data package for HyMAX Krishna Talluru, Liam McQuellin & Andrew Neely Hypersonics group, UNSW Canberra. Email for correspondence: k.talluru@adfa.edu.au
Input data Cantilever plate, static shock generator at 2 degrees (mandatory) and 10 degrees (optional) Run # Total pressure : 980 40 kPa Total temperature: 580 2 K Freestream pressure: 755 5 Pa Freestream temperature: 75 2 K Model wall temperature: 300 2 K Mach number: 5.8 0.06 Unit Reynolds number: 7.1 x 10⁶ Freestream conditions Ludwieg tube at University of Southern Queensland (TUSQ), Australia Test flow: Free jet Test gas: Compression heated air Flow start: Bursting of diaphragm Flow duration: 0.2 0.01 seconds (Time series data of freestream pressure fluctuations will be provided on request.) HyMAX Facility operation Geometry Refer to page 3. Sensor locations Refer to page 4.
Geometry Variable Value a 130 mm b 80 mm h 2 mm Shock generator -3o w = + w 5o Resultant wedge angle 2o See the next page for the locations of pressure transducers, strain gages and thin film gages. CAD files will be provided on request. Note: All dimensions are in mm. Details of the wedge geometry can be found in Currao et al., Hypersonic Oscillating Shock-Wave/Boundary-Layer Interaction on a Flat Plate , vol. 59, AIAA 2021.
Sensor locations (Bolted joint) Data sets available: 1. Spatial pressure distribution history (Pressure Sensitive Paint). 2. High-speed schlieren video history (flow field structure). 3. High-speed displacement history (image tracking of schlieren). 4. Heat flux measurements from four thin film gauges on the panel. 5. Laser scanner measurements on the centerline of the cantilever plate. 6. Pressure histories from discrete sensors at four locations on the panel. 7. Strain gage measurements at two locations near the hinge line. Note: All dimensions are in mm.
Sample data/results Figure 1: Timeseries of displacement of the trailing edge using laser scanner, image tracking and 2D laminar simulation. (a) (b) Figure 2: Power spectral density of (a) trailing edge displacement and (b) pressure fluctuations at four locations on the panel.
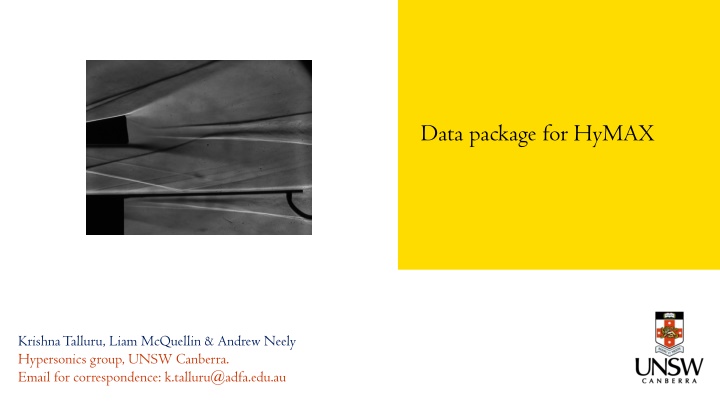
schlieren visualization 2o Static shock generator Cantilever plate


