Explore detailed data reports, tables, and publications outlining processes of data cleaning, analysis of employment outcomes, and educational trends for graduates. Gain insights into labor market activities, full-time study, and graduate destinations.
Please find below an Image/Link to download the presentation.
The content on the website is provided AS IS for your information and personal use only. It may not be sold, licensed, or shared on other websites without obtaining consent from the author. If you encounter any issues during the download, it is possible that the publisher has removed the file from their server.
You are allowed to download the files provided on this website for personal or commercial use, subject to the condition that they are used lawfully. All files are the property of their respective owners.
The content on the website is provided AS IS for your information and personal use only. It may not be sold, licensed, or shared on other websites without obtaining consent from the author.
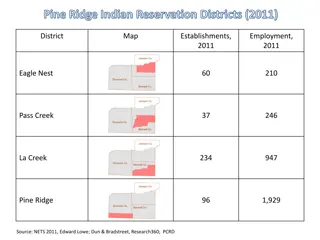
Data cleaning (Sept-Oct) Draft Tables A & B for SM confirmation Final Tables A & B after SM confirmation Tables A1 A16 show main destinations in terms of employment, labour market activity and further full- time study Based on DEST variable NOT activity or working
Tables A1 A16 include standardised results for bachelor degree graduates Domestics all, male & female, under 25, honours Internationals Domestics + Internationals ATSI, NESB & disability (access & equity) Other levels of award including, graduate certificates, graduate & postgraduate diplomas, masters coursework & research and PhDs
Tables B1 B16 show standardised labour market status of graduates available for full-time employment Based on AVAILFT2 variable NOT activity or working variables AVAILFT2 is derived from DEST 1 In full-time employment 2 Working part-time & seeking full-time employment 3 Not working & seeking full-time employment
Clean national data file late November GradStats and GradFiles summary publications produced in December Sent to SMs Preliminary data file to DEEWR in December Final national data file checks in January
Start work on AGS reports: AGS (new), Graduate Destinations, Graduate Salaries, Graduate Course Experience (CEQ), Postgraduate Destinations, Postgraduate Research Experience (PREQ) late January Summary reports, all tables and graphics still produced Sent to SMs CEQ files for START February Mean and percentage agreement figures Tables show CEQ results by institution, level of award and field of education SMs advised
GDS files for START February Tables A J Destinations, Employment and Salaries SMs advised National AGS files available to institutions GDS+CEQ and GDS+PREQ Word document describing data files No institutional identification in GDS+PREQ files
Hobsons March To be discussed in more detail later VC authorisation Cut-down GDS file supplied by GCA (to all) CEQ tables supplied by GCA (to all) Files for Careers Services March Employer details Further study information GDS information important to careers advisers


")
")


, Graduate")