Explore theories in data science, including preferential attachment models, robotics, and Kleiber's Law. Learn why theory is essential for understanding data patterns, proposing data generation mechanisms, and inferring system components. Traditional views on linear and multivariate models are also discussed.
Please find below an Image/Link to download the presentation.
The content on the website is provided AS IS for your information and personal use only. It may not be sold, licensed, or shared on other websites without obtaining consent from the author. If you encounter any issues during the download, it is possible that the publisher has removed the file from their server.
You are allowed to download the files provided on this website for personal or commercial use, subject to the condition that they are used lawfully. All files are the property of their respective owners.
The content on the website is provided AS IS for your information and personal use only. It may not be sold, licensed, or shared on other websites without obtaining consent from the author.
E N D
Presentation Transcript
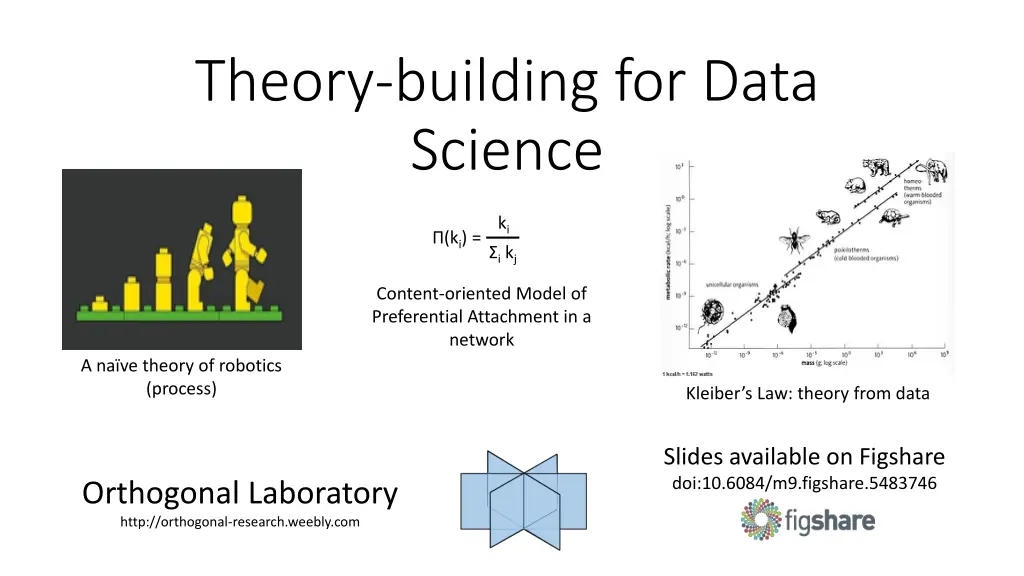
Theory-building for Data Science ki (ki) = i kj Content-oriented Model of Preferential Attachment in a network A na ve theory of robotics (process) Kleiber s Law: theory from data Slides available on Figshare doi:10.6084/m9.figshare.5483746 Orthogonal Laboratory http://orthogonal-research.weebly.com
Why Do Why Do W We Need Theory? e Need Theory? Theory allows us to: * comprehend patterns in the data. * propose candidate mechanisms for data generation. * infer missing components of the system that generates data.
Traditional View (general linear model) Describe Data as a Function Independent Variable Dependent Variable DV Measure Manipulate IV
Traditional View (general linear model) Describe Data as a Function Independent Variable Dependent Variable DV Measure Manipulate Causality IV
Traditional View (multivariate model) Independent Variable I Relative contribution to DV Dependent Variable Manipulate DV Measure Independent Variable II Manipulate PC1
Traditional View (multivariate model) Independent Variable I Relative contribution to DV Dependent Variable Manipulate DV Measure Independent Variable II Components of Variance Manipulate PC1
Traditional View (interacting variables) Independent Variable (Input) Input as a manipulable property of the network DV Dependent Variable (Output) IV
Traditional View (interacting variables) Independent Variable (Input) DV Output as the generative property of the network Dependent Variable (Output) IV
A Theory of Data Clyde H. Coombs proposed a theory of data. * methods for collecting and analyzing data. Content-oriented models (e.g. multidimensional psychophysics) * cast in mathematical form as miniature behavior theories. * broader applicability. * formulate alternative hypotheses and theories.
Content-oriented Model Fechner s Law: find the noticeable difference between two sets of visual arrays
Content-oriented Model Fechner s Law: find the noticeable difference between two sets of visual arrays
Content-oriented Model Fechner s Law: find the noticeable difference between two sets of visual arrays dp = kdS S Use equation to describe visual perceptual data: just noticeable difference in stimulus magnitude changes.
In A Theory of Data, the theoretical model should bring us closer to recovering the true phenomenological space. This is generally true under two conditions: * if phenomenon is lawlike (follows a set of regularities). * if data provide a direct or inferential window to phenomenon.
Grammar of Graphics by Leland Wilkinson. A theory of data extended for computer science. Two views of data: 1) realist: data represent indirectly observed process or phenomenon (biological evolution, collective behavior, exoplanet detection). 2) nominalist: data represent whatever they describe (color and shape of rocks, DNA nucleotide sequence).
Abstractions as mini-theoretical models: * data function used to arrange data elements. * m x n array (structure), third-order polynomial (tendency). Tucker s theory of abstract data types: * mathematical model defined by user: model has a level of computability. * level of behavioral completeness.
So far, we have three ways to get to a mini- theory 1) content-oriented (assumes regularity of datapoints). 2) measurement (pairwise to n-wise comparison of datapoints). 3) abstraction (combination of 1 and 2).
0 1 1 1 0 0 00 0 1 0 10 0 1 0 1 0 1 0 1 1 1 0 0 0 0 0 1 1 1 Source Input Data 0 1 1 0 1 0 1 0 0 1 0 1 1 0 Mini-theories can also create sense- making models of the world. y Xn+1=Xn Mini-theory Classification Scheme
0 1 1 1 0 0 00 0 1 0 10 0 1 0 1 0 1 0 1 1 1 0 0 0 0 0 1 1 1 Source Input Data 0 1 1 0 1 0 1 0 0 1 0 1 1 0 Mini-theories can also create sense- making models of the world. y Xn+1=Xn Mini-theory Do mini-theories create (or dream of) electric sheep? Classification Scheme
0 1 1 1 0 0 00 0 1 0 10 0 1 0 1 0 1 0 1 1 1 0 0 0 0 0 1 1 1 Source Input Data 0 1 1 0 1 0 1 0 0 1 0 1 1 0 Mini-theories can also create sense- making models of the world. y Xn+1=Xn Mini-theory Do mini-theories create (or dream of) electric sheep? Classification Scheme
Data-driven science is a failure of imagination. Petr Keil blog, January 2, 2013 Bayesian Models: conditionalprobabilistic statements as generalized hypothesis test p(theory|data) Consistent with a theoretical but na ve view of the world. More data makes it harder to test simple theories.
Data-driven science is a failure of imagination. Petr Keil blog, January 2, 2013 Linear regression model scenarios: N = sample size. Effect = positive statistical test. Support = from theoretical model. * structure of data (e.g. feature space) not sample size determines power of data . explanatory
Nave theories COURTESY: Cognitive Psychology, 52, 170-194 (2006). Na ve theory as formalized sensemaking Extramission theory of vision Transformational theory of evolution
de de Navitus Navitus models models What is plausible given no formal theory (beyond Na ve Bayes)?
de de Navitus Navitus models models What is plausible given no formal theory (beyond Na ve Bayes)? Epistemological Models1? Equation-free models (empirical dynamic modeling)2? 1 Elragal, A. and Klischewski, R. (2017). Theory-driven or process-driven prediction? Epistemological challenges of big data analytics. Journal of Big Data, 4, 19. 2 DeAngelis, D.L. and Yurek, S. (2015). Equation-free modeling unravels the behavior of complex ecological systems. PNAS, 112(13), 3856 3857.
de de Navitus Navitus models models What is plausible given no formal theory (beyond Na ve Bayes)? Epistemological Models1? Equation-free models (empirical dynamic modeling)2? What is intuitive given a set of correlations and limited causal information (time-series, priors)? 1 Elragal, A. and Klischewski, R. (2017). Theory-driven or process-driven prediction? Epistemological challenges of big data analytics. Journal of Big Data, 4, 19. 2 DeAngelis, D.L. and Yurek, S. (2015). Equation-free modeling unravels the behavior of complex ecological systems. PNAS, 112(13), 3856 3857.
A Topological Way to View Data and Theory A C DATA Mini-theory (equation) (observed) Suppe, Semantic Conception of Theories and Scientific Realism B Data explained by the mini-theory
A Topological Way to View Data and Theory A C A DATA Mini-theory (equation) Amount of data unexplained by the mini-theory (C). (observed) B Data explained by the mini-theory
A Topological Way to View Data and Theory A C B DATA Mini-theory (equation) Amount of data (A) explained by the mini-theory (C). (observed) B Data explained by the mini-theory
A Topological Way to View Data and Theory A C C DATA Mini-theory (equation) Amount that the mini-theory underspecifies the data. (observed) B Data explained by the mini-theory
A Topological Way to View Data and Theory Each sub-theory describes a small portion of the data. MT1 * describe a significant portion. taken together, they MT2 A DATA MT3 (observed)
A Topological Way to View Data and Theory Relationship between multiple sub- theories and the data. Each sub-theory describes a small portion of the data. MT1 11 possible sets of relationships: * describe a significant portion. taken together, they * (covariance). between sub-theories MT2 A * between sub-theories and data (explanatory power). DATA MT3 (observed) * sub-theory and data that do not overlap (underspecification).
Theory and Meta-theory? (automatic extraction of context-free knowledge from the data) Mathematical Discovery Programs (e.g. OpenCyc1, Eureqa2) Knowledge Base (theory) META Information about how theory operates and what it produces discovery in the form of concepts (axioms), equations, and heuristic rules. 1 Elkan and Greiner, Building large knowledge-based systems: representation and inference in the cyc project. Artificial Intelligence, 61(1), 41 52 (1993). 2 Schmidt and Lipson, Distilling free-form natural laws from experimental data. Science, 324(5923), 81-85 (2009).