Data Types and Categories in Statistical Analysis
Explore the fundamentals of data types in statistical analysis, including categorical and numerical classifications. Learn about the operationalization of concepts, smoking habits definitions, and the divisions of data into categories like nominal and ordinal. Gain insights into statistical methods for data analysis and the significance of different levels of measurement in data interpretation.

Download Presentation

Please find below an Image/Link to download the presentation.
The content on the website is provided AS IS for your information and personal use only. It may not be sold, licensed, or shared on other websites without obtaining consent from the author. If you encounter any issues during the download, it is possible that the publisher has removed the file from their server.
You are allowed to download the files provided on this website for personal or commercial use, subject to the condition that they are used lawfully. All files are the property of their respective owners.
The content on the website is provided AS IS for your information and personal use only. It may not be sold, licensed, or shared on other websites without obtaining consent from the author.
E N D
Presentation Transcript
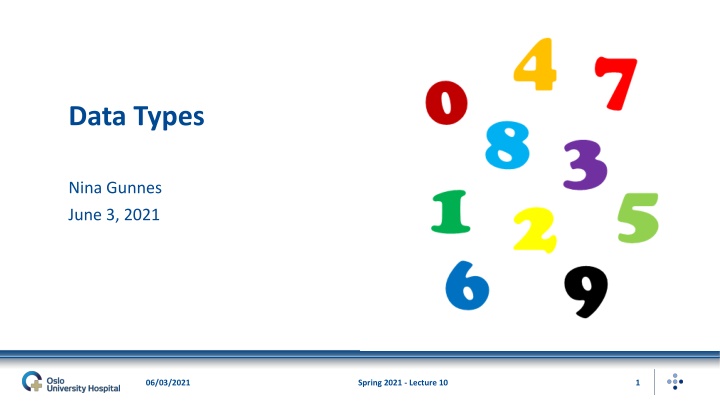
Data Types Nina Gunnes June 3, 2021 06/03/2021 Spring 2021 - Lecture 10 1
Data types Two main types of data Categorical Numerical Depending on the operationalization of concepts or characteristics Pain Body function (e.g., being able-bodied) Quality of life Determining the choice of statistical method for data analysis 06/03/2021 Spring 2021 - Lecture 10 2
Data types, cont. Different operational definitions of smoking habits 1. Are you a smoker? [ ] yes [ ] no 2. Are you a [ ] smoker [ ] former smoker [ ] non-smoker? 3. How many cigarettes do you smoke per day on average? [ ] 4. Are you a [ ] non-smoker [ ] former smoker [ ] occasional smoker [ ] moderate smoker [ ] heavy smoker (at least 20 cigarettes/day)? 5. Evaluate your smoking habits on a scale from 0 (non-smoker) to 4 (heavy smoker, at least 20 cigarettes/day): 0 1 2 3 4 6. Evaluate your smoking habits on a scale from 0 (non-smoker) to 10 (heavy smoker, at least 20 cigarettes/day): 0 1 2 3 4 5 6 7 8 9 10 7. For how many years have you been smoking? [ ] Based on Table 2.1 in Laake et al. (2007) 06/03/2021 Spring 2021 - Lecture 10 3
Categorical data Dividing data set into categories, or groups Values not necessarily representing an exact measure Dichotomous data being the simplest form of data Data set grouped into two categories (e.g., exposed and unexposed) Statistical description based on the number or proportion in each category Two levels of measurement Nominal Ordinal 06/03/2021 Spring 2021 - Lecture 10 4
Nominal data Unordered categorical data Grouping the data set into categories of no natural order Toxic substances of exposure Side effects of medication Potentially overlapping groups Subjects belonging to more than one category Sum of category frequencies greater than the total number of subjects Summarized by frequency distribution, bar chart, pie chart, etc. 06/03/2021 Spring 2021 - Lecture 10 5
Ordinal data Ordered categorical data Grouping the data set into categories of some natural order Category A > Category B > Category C > (or vice versa) Categories representing an ordered sequence Smoking habits: non-smoker, former smoker, smoker Health: very good, good, less good, bad Only (!) expressing an ordering of the data No information about quantity or distance between categories 06/03/2021 Spring 2021 - Lecture 10 6
Ordinal data, cont. Conversely, where ordered categories are numbered, as with stage of disease or social class, the temptation to treat these numbers as statistically meaningful must be resisted. For example, it is not sensible to calculate the average social class or stage of cancer. The only information the numbers contain is in the ordering, which would be conveyed equally by calling them A, B, C, D and so on. Altman (1991), page 12 06/03/2021 Spring 2021 - Lecture 10 7
Ordinal data, cont. Extremes sometimes encoded as 0 and 100, respectively Impression of more possible values than the limited number of categories Numerical codes often (erroneously!) treated as ordinary numbers Meaningless to add, subtract, or average ordinal data Described by frequencies and appropriate descriptive statistics Median Quartiles Statistical analysis unaffected by the choice of numerical codes 06/03/2021 Spring 2021 - Lecture 10 8
Ordinal data, cont. Examples of different scales for ordered responses Letter scale A, B, C, D, Numerical scale 1, 2, 3, 0, 1, 2, 1, , 10 Verbally descriptive scale None Weak Moderate Strong All the time Most of the time Part of the time Little of the time None of the time Very bad Bad Less good Good Pictograms Symbols (-) (+) (++) (+++) Visual analog scale (VAS) Nothing Extremely Extremely strong Extremely weak Based on Table 2.5 in Laake et al. (2007) 06/03/2021 Spring 2021 - Lecture 10 9
Visual analog scale (VAS) Forming approximately continuous ordinal data Often a 100 mm straight line Measurement given by a marking on the line Value between two extremes Many possible positions Different definitions of the extremes Perceived level of discomfort, pain, etc.: 0 nothing vs. 100 extreme Bipolar (two opposite characteristics): uncertain vs. self-confident 06/03/2021 Spring 2021 - Lecture 10 10
Numerical data Mathematically the highest form of data Clearly defined quantity and distance between values Twice as much Decrease of 5 kg Several options for describing and analyzing the data Median and mean both valid Important information from scatter plot or histogram Indication of suitable methods to apply 06/03/2021 Spring 2021 - Lecture 10 11
Numerical data, cont. Four different types Count data Continuous non-negative data Continuous interval-limited data Continuous unlimited data Continuous numerical data not requiring any decimals Important to distinguish non-negative data from other numerical data Often right-skewed (i.e., long right tail) 06/03/2021 Spring 2021 - Lecture 10 12
Numerical data, cont. Descriptive statistics depending on the distribution Median and quartiles for non-negative data Mean and standard deviation for continuous unlimited data Two levels of measurement Interval (no true zero point): temperature in Fahrenheit or Celsius, dates, etc. Ratio (a true zero point): height, weight, age, etc. 06/03/2021 Spring 2021 - Lecture 10 13
Summary Categorical data Dichotomous data Exposure: exposed, unexposed Obesity: obese, non-obese Smoking habits: smoker vs. non-smoker Sex: male, female Nominal data Type of strenuous work (heavy lifting, monotone working posture, etc.) Name of toxic/carcinogenic substance of exposure Ordinal data Smoking habits: non-smoker, former smoker, smoker Blood pressure: low, normal, high Degree of overweight: moderate, high, very high Pain: 0, 1, 2, 3, 4 Perceived health: very good, good, less good, bad Based on Table 2.4 in Laake et al. (2007) 06/03/2021 Spring 2021 - Lecture 10 14
Summary, cont. Numerical data Count data Number of diseased or deceased Number of cigarettes smoked per day Continuous non-negative data Time as a smoker (years) Blood pressure (mmHg) Degree of overweight: body mass index (kg/m2) Concentration of toxic/carcinogenic substance in the blood (mg/ml, mmol/ml) Continuous interval-limited data Drug uptake (%) Degree of overweight: percentage of body fat measured by densitometry (%) Continuous unlimited data Change in body weight (kg) Change in blood pressure (mmHg) Change in total cholesterol (mmol/l) Based on Table 2.4 in Laake et al. (2007) 06/03/2021 Spring 2021 - Lecture 10 15
Summary, cont. Scribbr, https://www.scribbr.com/statistics/levels-of-measurement/(June 2, 2021) 06/03/2021 Spring 2021 - Lecture 10 16
References Laake P, Hjart ker A, Thelle DS, Veier d MB. Epidemiologiske og kliniske forskningsmetoder. Oslo: Gyldendal akademisk; 2007. https://www.med.uio.no/imb/forskning/publikasjoner/boker/2007/epide miolgiske-kliniske-forskningsmetoder.html. Scribbr. Levels of measurement: Nominal, ordinal, interval, ratio. July 16, 2020. Revised January 27, 2021. Accessed June 2, 2021. https://www.scribbr.com/statistics/levels-of-measurement/. Statistics Solutions. Data Levels of Measurement. 2021. Accessed June 2, 2021. https://www.statisticssolutions.com/dissertation- resources/descriptive-statistics/data-levels-of-measurement/. 06/03/2021 Spring 2021 - Lecture 10 17


")