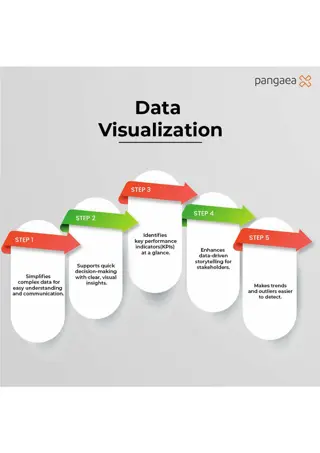
Data Visualization Best Practices for Effective Presentations
This slideshow offers general best practices for creating impactful data visualizations for both print and digital presentations. It covers topics such as determining the best display method, the 3 Es of displaying data (Effective, Ethical, Efficient), effective display placement, ethical considerations in data representation, and examples of ethical graph usage. Emphasizing the importance of honesty, accuracy, and clarity in visual data presentation, this resource aims to help creators construct compelling and trustworthy visual narratives.

Download Presentation

Please find below an Image/Link to download the presentation.
The content on the website is provided AS IS for your information and personal use only. It may not be sold, licensed, or shared on other websites without obtaining consent from the author.If you encounter any issues during the download, it is possible that the publisher has removed the file from their server.
You are allowed to download the files provided on this website for personal or commercial use, subject to the condition that they are used lawfully. All files are the property of their respective owners.
The content on the website is provided AS IS for your information and personal use only. It may not be sold, licensed, or shared on other websites without obtaining consent from the author.
E N D
Presentation Transcript
Data Visualization Best Practices LIZ LANE Brought to you in cooperation with the Purdue Online Writing Lab
Data Visualization Best Practices This slideshow provides general best practices for working with data visualizations meant for display in print or digital publication or slideshow presentations.
Determining Display Type Though it can be tempting to use flashy or novel visual presentation tools, consider the best display method for your information:
3 Es of Displaying Data Effective Ethical Efficient
Effective Display Assure that the visual is placed within proximity to the text and vice versa. Visuals give readers opportunities to pause and consider the ideas in the text Graphics visually reinforce your argument; readers tend to trust what they can see Tell a simple story with your data
Example 1 Graphic via: NOAA National Weather Service semi-annual report on climate change. http://climate.nasa.gov/causes/
Ethical Display Be absolutely honest with your readers. Do not be tempted to exaggerate trends or inflate results. If you did not create the graphic or generate the data, cite your source. If you want to publish a graphic that you did not create, obtain permission.
Ethical Display Include all relevant data. For instance, if you have a data point that you cannot explain, do not change the scale to eliminate it. Represent quantities honestly (see be ethical points above) Do not use a table to hide a data point that would be obvious in a graph Do not use color to misrepresent an item s importance. (Shade can trick the idea to make elements appear larger than darker- shaded items of the same size)
Example 2 Graphic via: Kouro, S.; Leon, J.I.; Vinnikov, D.; Franquelo, L.G., "Grid-Connected Photovoltaic Systems: An Overview of Recent Research and Emerging PV Converter Technology," in Industrial Electronics Magazine, IEEE , vol.9, no.1, pp.47-61, March 2015
Effecient Display When using color, aim for careful and minimal usage Don t use color where black and white will work better Color can help establish visual patterns, but don t overuse color. Readers can typically interpret only two or three colors at a time.
Color & Contrast Color Sets with Strong Contrast (on screen and in print) White or neutral backgrounds with bold, warm text or annotation colors provide the strongest contrast.
Best Contrasting Colors Strong Contrast. Stick with the basics- black & white. Strong Contrast. Best for visual annotations or charts on screen.
Example 3 Graphic via: Rahimi-Eichi, H.; Ojha, U.; Baronti, F.; Chow, M., "Battery Management System: An Overview of Its Application in the Smart Grid and Electric Vehicles," in Industrial Electronics Magazine, IEEE , vol.7, no.2, pp.4-16, June 2013
Grayscale & Texture o Gray scale take advantage of texture options in graphics, such as lines, dots, or hash marks. Tip: it s handy to view your color graphics in gray scale as you work to assure that your graphics represent the data well, taking care to make sure no two colors are similar or muddied.
Layout & Typography Your data visualizations will likely be presented alongside text, or work in concert with text such as titles, subtitles or labels. When working with these elements, the following tips provide general approaches for assuring readers can easily access, read, and interpret the information you provide in your data visualizations.
Layout HATS Principles & Effective Integration of Visuals Headings: promote easy navigation Access: promote the finding and understanding of information Typography: promote the ease of reading and clear levels of information hierarchy Space: promote effective document design
The End DATA VIZULIZATION BEST PRACTICES LIZ LANE Brought to you in cooperation with the Purdue Online Writing Lab