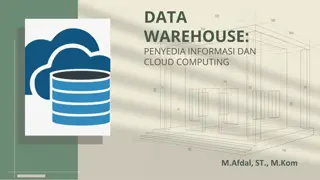
Data Warehouse: Centralized Repository for Analysis and Reporting

A data warehouse serves as a centralized repository for storing large volumes of data from multiple sources to facilitate analysis and reporting. It provides a consolidated view of data to support business intelligence activities. The key concepts include the ETL process, data integration, architecture components like data sources, staging area, data warehouse database, data marts, metadata, and OLAP tools. Understanding the ETL process is crucial, as it involves extracting, transforming, and loading data into the final source. Explore the architecture, data sources, and the significance of metadata in a data warehouse environment.

Download Presentation

Please find below an Image/Link to download the presentation.
The content on the website is provided AS IS for your information and personal use only. It may not be sold, licensed, or shared on other websites without obtaining consent from the author.If you encounter any issues during the download, it is possible that the publisher has removed the file from their server.
You are allowed to download the files provided on this website for personal or commercial use, subject to the condition that they are used lawfully. All files are the property of their respective owners.
The content on the website is provided AS IS for your information and personal use only. It may not be sold, licensed, or shared on other websites without obtaining consent from the author.
E N D
Presentation Transcript
Data warehouse Dr. Nagsen Bansod Assistant Professor, Dr. G. Y. Pathrikar college of CS and IT MGM University, Chhatrapati Sambhajinagar
Introduction Introduction
Introduction Definition: Explain what a data warehouse is a centralized repository for storing large volumes of data from multiple sources for analysis and reporting. Purpose: Highlight the primary purpose of a data warehouse, which is to provide a consolidated view of data to support business intelligence activities.
Key Concepts Key Concepts ETL Process: Explain the Extract, Transform, Load (ETL) process, which involves extracting data from different sources, transforming it to fit operational needs, and loading it into the data warehouse. Data Integration: Emphasize the importance of integrating data from various sources to ensure consistency and accuracy.
Architecture Data Sources: Outline the different data sources that feed into a data warehouse, such as transactional databases, external data sources, and flat files. Staging Area: Explain the role of the staging area where data is cleaned and transformed before loading into the warehouse. Data Warehouse Database: Describe the central repository where the integrated data is stored. Data Marts: Introduce data marts, which are subsets of the data warehouse tailored for specific business areas or departments. Metadata: Explain the importance of metadata, which describes the data and its structure within the data warehouse. OLAP (Online Analytical Processing): Discuss OLAP tools that enable fast querying and analysis of the data.
ETL Process ETL stands for Extraction, Transformation, and loading. ETL is a process which is used to Extract data, Transform the data and loading of the data to the final source. ETL follows a process of loading the data from the source system to the Data Warehouse.
Extraction Extraction is the first process where data from different sources like text file, XML file, Excel file, or various other sources are collected.
Transformation Transformation is the second step of the ETL process, where all the collected data has been transformed into the same format. The format can be anything as per our requirement. In this step, a set of rules of functions are applied to the extracted data to convert it into a single standard format. It may involve the following tasks: Filtering: Only specific attributes are loading into the data warehouse. Cleaning: Filling up the null values with specific default values. Joining: Join the multiple attributes into the one. Splitting: Splitting the single attribute into multiple attributes. Sorting: Sort the tuples based on the attributes.
Loading Loading is the final step of the ETL process. The big chunk of data is collected from various sources, transformed them, and finally loaded to the data warehouse. ETL is a process to extract the data from different source systems, transform the data, and load the data into the data warehouse. ETL process requires active input from various stakeholders including, developers, analysts, testers, top executive. ETL (Extract, Transform and Load) is an automated process of extracting the information from the raw data which is required for analysis and transforms it into a format that can serve business needs and loads it into a data warehouse. ETL typically summarize data to reduce its size and improve performance for a specific type of analysis.
ETL process uses the pipelining concept. In this concept, as soon as the data is extracted, it can be transformed, and during the period of transformation, new data can be obtained. And when the modified data is being loaded into the data warehouse, the already extracted data can be transformed.
OLTP and OLAP OLTP (Online Transaction Processing): A type of data processing focused on managing transaction-oriented applications. It supports daily operations of businesses, like order entry, financial transactions, and customer relationship management. OLAP (Online Analytical Processing): A type of data processing focused on analyzing large volumes of data. It supports complex queries and is used for business intelligence, data mining, and decision support systems.
Key Differences Feature OLTP OLAP Purpose Data Operations Data Volume Manage day-to-day transactions Support complex data analysis Insert, Update, Delete, Select Typically smaller, operational dataTypically larger, historical data Read-only, complex queries De-normalized (star/snowflake schema) Complex, multi-dimensional queries Query response time and flexibility Data Structure Highly normalized Query Types Simple, standardized queries Performance FocusSpeed and efficiency of transactions Example Use CasesOrder processing, banking transactions Sales analysis, market research
OLAP Characteristics OLAP Characteristics Data Warehouses: Centralized repositories that store large volumes of historical data for analysis. Batch Processing: Data is often processed in batches and periodically loaded into the data warehouse. De-normalization: Data is often de-normalized to improve query performance and simplify data modeling. Multidimensional Analysis: Data is organized into dimensions and facts, allowing for complex analytical queries.
Data Warehouse Modeling Data warehouse modeling is the process of designing the schemas of the detailed and summarized information of the data warehouse. The goal of data warehouse modeling is to develop a schema describing the reality, or at least a part of the fact, which the data warehouse is needed to support.
Data Warehouse Design A data warehouse is a single data repository where a record from multiple data sources is integrated for online business analytical processing (OLAP). This implies a data warehouse needs to meet the requirements from all the business stages within the entire organization. Thus, data warehouse design is a hugely complex, lengthy, and hence error-prone process. Furthermore, business analytical functions change over time, which results in changes in the requirements for the systems. Therefore, data warehouse and OLAP systems are dynamic, and the design process is continuous.
Data warehouse design takes a method different from view materialization in the industries. It sees data warehouses as database systems with particular needs such as answering management related queries. The target of the design becomes how the record from multiple data sources should be extracted, transformed, and loaded (ETL) to be organized in a database as the data warehouse. There are two approaches "top-down" approach "bottom-up" approach
op-down Design Approach In the "Top-Down" design approach, a data warehouse is described as a subject-oriented, time-variant, non-volatile and integrated data repository for the entire enterprise data from different sources are validated, reformatted and saved in a normalized (up to 3NF) database as the data warehouse. The data warehouse stores "atomic" information, the data at the lowest level of granularity, from where dimensional data marts can be built by selecting the data required for specific business subjects or particular departments. An approach is a data-driven approach as the information is gathered and integrated requirements by subjects for building data marts are formulated. The advantage of this method is which it supports a single integrated data source. Thus data marts built from it will have consistency when they overlap. first and then business
Bottom-Up Design Approach In the "Bottom-Up" approach, a data warehouse is described as "a copy of transaction data specifical architecture for query and analysis," term the star schema. In this approach, a data mart is created first to necessary reporting and analytical capabilities for particular business processes (or subjects). Thus it is needed to be a business-driven approach in contrast to Inmon's data-driven approach. Data marts include the lowest grain data and, if needed, aggregated data too. Instead of a normalized database for the data warehouse, a denormalized dimensional database is adapted to meet the data delivery requirements of data warehouses. Using this method, to use the set of data marts as the enterprise data warehouse, data marts should be built with conformed dimensions in mind, defining that ordinary objects are represented the same in different data marts. The conformed dimensions connected the data marts to form a data warehouse, which is generally called a virtual data warehouse.
1. Requirements analysis and capacity planning: The first process in data warehousing involves defining enterprise needs, defining architectures, carrying out capacity planning, and selecting the hardware and software tools. This step will contain be consulting senior management as well as the different stakeholder. 2. Hardware integration: Once the hardware and software has been selected, they require to be put by integrating the servers, the storage methods, and the user software tools. 3. Modeling: Modelling is a significant stage that involves designing the warehouse schema and views. This may contain using a modeling tool if the data warehouses are sophisticated.
4. Physical modeling: For the data warehouses to perform efficiently, physical modeling is needed. This contains designing the physical data warehouse organization, data placement, data partitioning, deciding on access techniques, and indexing. 5. Sources: The information for the data warehouse is likely to come from several data sources. This step contains identifying and connecting the sources using the gateway, ODBC drives, or another wrapper. 6. ETL: The data from the source system will require to go through an ETL phase. The process of designing and implementing the ETL phase may contain defining a suitable ETL tool vendors and purchasing and implementing the tools. This may contains customize the tool to suit the need of the enterprises.
7. Populate the data warehouses: Once the ETL tools have been agreed upon, testing the tools will be needed, perhaps using a staging area. Once everything is working adequately, the ETL tools may be used in populating the warehouses given the schema and view definition. 8. User applications: For the data warehouses to be helpful, there must be end-user applications. This step contains designing and implementing applications required by the end-users. 9. Roll-out the warehouses and applications: Once the data warehouse has been populated and the end-client applications tested, the warehouse system and the operations may be rolled out for the user's community to use
1. Build incrementally: Data warehouses must be built incrementally. Generally, it is recommended that a data marts may be created with one particular project in mind, and once it is implemented, several other sections of the enterprise may also want to implement similar systems. An enterprise data warehouses can then be implemented in an iterative manner allowing all data marts to extract information from the data warehouse. 2. Need a champion: A data warehouses project must have a champion who is active to carry out considerable researches into expected price and benefit of the project. Data warehousing projects requires inputs from many units in an enterprise and therefore needs to be driven by someone who is needed for interacting with people in the enterprises and can actively persuade colleagues. 3. Senior management support: A data warehouses project must be fully supported by senior management. Given the resource-intensive feature of such project and the time they can take to implement, a warehouse project signal for a sustained commitment from senior management.
4. Ensure quality: The only record that has been cleaned and is of a quality that is implicit by the organizations should be loaded in the data warehouses. 5. Corporate strategy: A data warehouse project must be suitable for corporate strategies and business goals. The purpose of the project must be defined before the beginning of the projects. 6. Business plan: The financial peopleware), expected advantage, and a project plan for a data warehouses project must be clearly outlined and understood by all stakeholders. Without such understanding, rumors about expenditure and benefits can become the only sources of data, subversion the projects. costs (hardware, software, and
7. Training: Data warehouses projects must not overlook data warehouses training requirements. For a data warehouses project to be successful, the customers must be trained to use the warehouses and to understand its capabilities. 8. Adaptability: The project should build in flexibility so that changes may be made to the data warehouses if and when required. Like any system, a data warehouse will require to change, as the needs of an enterprise change. 9. Joint management: The project must be handled by both IT and business professionals in the enterprise. To ensure that proper communication with the stakeholder and which the project is the target for assisting the enterprise's business, the business professional must be involved in the project along with technical professionals.
What is Meta Data? Metadata is data about the data or documentation about the information which is required by the users. In data warehousing, metadata is one of the essential aspects. Metadata includes the following: 1. The location and descriptions of warehouse systems and components. 2. Names, definitions, structures, and content of data-warehouse and end-users views. 3. Identification of authoritative data sources. 4. Integration and transformation rules used to populate data. 5. Integration and transformation rules used to deliver information to end-user analytical tools. 6. Subscription information for information delivery to analysis subscribers. 7. Metrics used to analyze warehouses usage and performance. 8. Security authorizations, access control list, etc.
Several examples of metadata are: A library catalog may be considered metadata. The directory metadata consists of several predefined components representing specific attributes of a resource, and each item can have one or more values. These components could be the name of the author, the name of the document, the publisher's name, the publication date, and the methods to which it belongs. The table of content and the index in a book may be treated metadata for the book. Suppose we say that a data item about a person is 80. This must be defined by noting that it is the person's weight and the unit is kilograms. Therefore, (weight, kilograms) is the metadata about the data is 80.
What is Data Mart? A Data Mart is a subset of a directorial information store, generally oriented to a specific purpose or primary data subject which may be distributed to provide business needs. Data Marts are analytical record stores designed to focus on particular business functions for a specific community within an organization. Data marts are derived from subsets of data in a data warehouse, though in the bottom-up data warehouse design methodology, the data warehouse is created from the union of organizational data marts.
The fundamental use of a data mart is Business Intelligence (BI) applications. BI is used to gather, store, access, and analyze record. It can be used by smaller businesses to utilize the data they have accumulated since it is less expensive than implementing a data warehouse.
Reasons for creating a data mart Creates collective data by a group of users Easy access to frequently needed data Ease of creation Improves end-user response time Lower cost than implementing a complete data warehouses Potential clients are more clearly defined than in a comprehensive data warehouse It contains only essential business data and is less cluttered.
Types of Data Marts here are mainly two approaches to designing data marts. These approaches are Dependent Data Marts Independent Data Marts
Dependent Data Marts A dependent data marts is a logical subset of a physical subset of a higher data warehouse. According to this technique, the data marts are treated as the subsets of a data warehouse. In this technique, firstly a data warehouse is created from which further various data marts can be created. These data mart are dependent on the data warehouse and extract the essential record from it. In this technique, as the data warehouse creates the data mart; therefore, there is no need for data mart integration. It is also known as a top- down approach.
Independent Data Marts he Independent data marts (IDM) Here, firstly independent data marts are created, and then a data warehouse using these multiple data marts. In this approach, as all the data marts are designed therefore, the integration of data marts is required. It is also termed as approach as the data marts are integrated to develop a data warehouse. second approach is is independent designed independently; a bottom-up
Hybrid Data Marts It allows us to combine input from sources other than a data warehouse. This could be helpful for many situations; especially when Adhoc integrations are needed, such as after a new group or product is added to the organizations.
OLAP Tools Data Model In the multidimensional model, the records are organized into various dimensions, and each dimension includes multiple levels of abstraction described by concept hierarchies. This organization support users with the flexibility to view data from various perspectives. A number of OLAP data cube operation exist to demonstrate these different views, allowing interactive queries and search of the record at hand. Hence, OLAP supports a user-friendly environment for interactive data analysis. Consider the OLAP operations multidimensional data. The figure shows data cubes for sales of a shop. The cube contains the dimensions, location, and time and item, where the location is aggregated with regard to city values, time is aggregated with respect to quarters, and an item is aggregated with respect to item types. which are to be performed on
Roll-Up The operation) performs aggregation on a data cube, by climbing down concept hierarchies, i.e., dimension reduction. Roll-up is like zooming- out on the data cubes. Figure shows the result of roll-up operations performed on the dimension location. The hierarchy for the location is defined as the Order Street, city, province, or state, country. The roll-up operation aggregates the data by ascending the location hierarchy from the level of the city to the level of the country. When a roll-up is performed by dimensions reduction, one or more dimensions are removed from the cube. For example, consider a sales data cube having two dimensions, location and time. Roll-up may be performed by removing, the time dimensions, appearing in an aggregation of the total sales by location, relatively than by location and by time. roll-up operation (also known as drill-up or aggregation
Example Consider the following cubes illustrating temperature of certain days recorded weekly: Temper ature 64 65 68 69 70 71 72 75 80 81 83 85 Week1 1 0 1 0 1 0 0 0 0 0 1 0 Week2 0 0 0 1 0 0 1 2 0 1 0 0 Consider that we want to set up levels (hot (80-85), mild (70-75), cool (64-69)) in temperature from the above cubes. To do this, we have to group column and add up the value according to the concept hierarchies. This operation is known as a roll-up.
By doing this, we contain the following cube: cool mild hot mperature Week1 2 1 1 Week2 2 1 1 The roll-up operation groups the information by levels of temperature.
Drill-Down The drill-down operation (also called roll-down) is the reverse operation of roll-up. Drill-down is like zooming-in on the data cube. It navigates from less detailed record to more detailed data. Drill-down can be performed by either stepping down a concept hierarchy for a dimension or adding additional dimensions. Figure shows a drill-down operation performed on the dimension time by stepping down a concept hierarchy which is defined as day, month, quarter, and year. Drill-down appears by descending the time hierarchy from the level of the quarter to a more detailed level of the month.
ecause a drill-down adds more details to the given data, it can also be performed by adding a new dimension to a cube. For example, a drill- down on the central cubes of the figure can occur by introducing an additional dimension, such as a customer group.