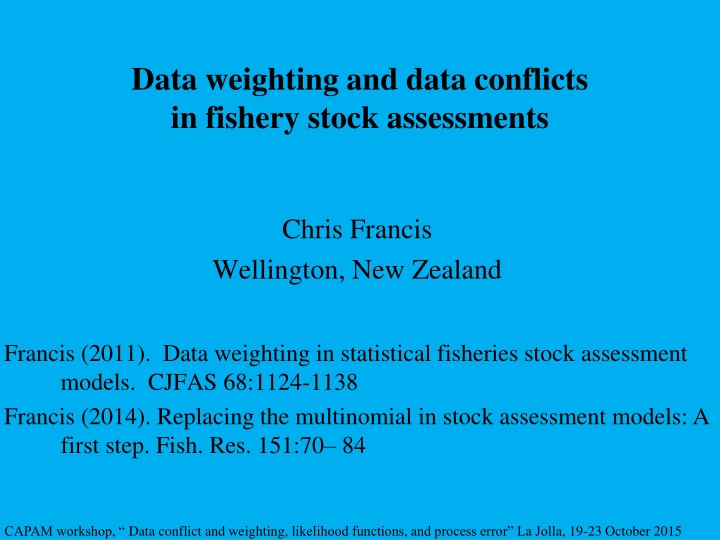
Data weighting and data conflicts in fishery stock assessments
Data weighting plays a crucial role in fisheries stock assessments as it can significantly impact stock status and the accuracy of statistical inference. Correct weighting helps to reduce estimated uncertainty in models. Setting data weights correctly involves describing the likely error size of each observation based on its information content, with different approaches for abundance and composition data.

Download Presentation

Please find below an Image/Link to download the presentation.
The content on the website is provided AS IS for your information and personal use only. It may not be sold, licensed, or shared on other websites without obtaining consent from the author.If you encounter any issues during the download, it is possible that the publisher has removed the file from their server.
You are allowed to download the files provided on this website for personal or commercial use, subject to the condition that they are used lawfully. All files are the property of their respective owners.
The content on the website is provided AS IS for your information and personal use only. It may not be sold, licensed, or shared on other websites without obtaining consent from the author.
E N D
Presentation Transcript
Data weighting and data conflicts in fishery stock assessments Chris Francis Wellington, New Zealand Francis (2011). Data weighting in statistical fisheries stock assessment models. CJFAS 68:1124-1138 Francis (2014). Replacing the multinomial in stock assessment models: A first step. Fish. Res. 151:70 84 CAPAM workshop, Data conflict and weighting, likelihood functions, and process error La Jolla, 19-23 October 2015
Why is data weighting important? 1. Can strongly affect stock status 2. All statistical inference assumes correct weighting Increasing weightings tend to decrease estimated uncertainty (and vice versa)
Example of effect of reweighting on s.e.s (Chilean ling) Eff. sample sizes Standard errors Standard errors Standard errors Eff. sample sizes Age 100 100 10 10 Eff. sample sizes Age Age 100 Model Model Initial Reweight Model Initial Initial Reweight Length Length Length B0(t) Depletion(%) B0(t) Depletion(%) Ffinal Ffinal B0(t) Depletion(%) 339 339 339 504 +49% Ffinal 0.016 0.016 0.016 0.019 +21% 50 2.16 2.16 2.16 2.82 50 50 8 8 Change in s.e. +31%
What is correct data weighting? The weight given to each observation should describe the likely size of its error (and thus its information content) Model prediction Error Observation Real world
How to set data weights? Abundance data: outside the model (see Francis 2011); heteroscedastic if possible; no iterative reweighting Composition data*: requires iterative reweighting because it s not possible to quantify process error outside the model Some causes of process error for composition data: - misspecification of selectivity, M, and growth (for lengths) *Including tagging: propns by age or length of recaptures
Iterative reweighting of compositions 1. Set initial data weights* 2. Run assessment model 3. Adjust weights using model residuals [4. Repeat steps 2 & 3 as necessary] * Usually sample sizes; could be c.v.s
Initial weighting of compositions Two approaches: 1. To represent observation error - from bootstrapping of data (e.g., Stewart & Hamel 2014) 2. Ad hoc: e.g., number of sets or landings sampled Important: aim to capture year-to-year changes in reliability
Adjusting composition weightings From analysis of composition residuals in model output Most common method: McAllister & Ianelli (1998) - included in Stock Synthesis outputs - uses individual residuals My recommendation: Method TA1.8 etc (Francis 2011) - use residuals of mean age or mean length - adapts approach of Pennington & V lstad (1994) - available in r4ss (SSMethod.TA1.8, SSMethod.Cond.TA1.8)
Chilean hake example (Francis 2011) Chilean hake assessment Sample sizes for compositions Initial McA&I 150 258 150 240 150 557 150 338 13.5 Commercial trawl Commercial longline 16 Adjusted TA1.8 x x x 16 15 x 15 xx x x 14 Data set Trawl fishery Commercial longline Artisanal longline Survey 12 x x 14 xxx xx x 13 x x 13 x xx xx x 15 10 25 69 x 12 xx 12 x x xx x xx xxxx 11 Mean age (years) 11 x x 10 10 1985 1990 Artisanal longline 1995 2000 2005 1985 1990 1995 2000 2005 Survey x x 13.0 xx x 11 x x x xx x 12.5 x 10 xx x x x 12.0 9 1985 1990 1995 2000 2005 1985 1990 1995 2000 2005 Year
Correlations amongst individual composition residuals Commercial trawl McAllister & Ianelli approach overestimates sample sizes because it assumes residuals are uncorrelated
Main sources of composition correlations Observation error: - intra-haul correlation (Pennington & V lstad 1994) Process error: - misspecification of selectivities, M, growth
Comparison of observation & total error for hoki age compositions Actual sample sizes1 Otoliths 753 763 649 Effective sample sizes1 Obs. err. 937 261 116 Data set HOKwc HOKcs HOKcr Type Fishery Fishery Survey Lengths 53 061 10 527 19 172 1Median values over all years Total err. 20 69 83 Source: Table 1 of Francis (2014)
Research question: should adjustment be multiplicative or additive? TA1.8 ??, adjusted= ???, initial TA1.9 ??, adjusted= 1 1 ??, initial+ 1 ??, additional 0.5 TA1.10 ??, adjusted= ??, initial 2 2 + ??, additional Additive adjustment may be more appropriate if initial sample sizes represent observation error
How many iterations? Pragmatic approach: - until there s no visually significant change in fits & outputs (often, once is enough) My experience: - only large changes in N cause significant changes in the assessment
An alternative to iterative reweighting (Francis 2014) Replace the multinomial with a likelihood that - allows for realistic correlations - is self-weighting Possible replacement: logistic-normal
How to deal with abundance data that may be unrepresentative? Unrepresentative = wrong trend imprecise or noisy Common response: down-weight the data Better response: either fit well or discard
Why prioritise abundance data? Key stock assessment questions concern abundance Composition data can tell us - lots about recruitment variation - something about selectivities and growth - little about abundance (usually) Inference from composition data can easily be compromised by misspecification
What is meant by prioritise? Aim to achieve a good fit to all abundance data (don t let other data stop the model fitting abundance data well) Weight abundance data outside the model - no iterative reweighting - no concentrated likelihoods
Right-weighting and down-weighting of composition data Compositions should, ideally, be right-weighted (i.e., consistent with residual sizes, as with TA1.8) Right-weighting is important for valid statistical inference Right-weighting of compositions depends on model structure Apply further down-weighting only if necessary to achieve a satisfactory fit to abundance data (often not needed)
Conflict between two abundance series Bad assumption: both series are correct. Canadian 2J3KL cod stock Better assumption: one series is correct, but we don t know which one. Survey fig. 1 from Schnute & Hilborn 1993
Conflict amongst multiple abundance series 1. Create two or more alternative models using different abundance series 2. Ensure that all abundance series in each model are well fitted Differences between model outputs represent our uncertainty about which abundance series are representative
Conflicts involving compositions Most likely cause: misspecification Amongst compositions Abundance vs compositions
Is restructuring an alternative to data weighting? 1. Profiles good for detecting misspecification causing data conflicts 2. Better to remove the misspecification/conflict, than to down-weight compositions 3. Without data conflict, data weighting is unimportant
Some comments 1. Restructuring to reduce misspecification is good, and profiling is a useful tool 2. Why not restructure and reweight compositions? 3. If not, how to know if we have the right weights for our compositions? 4. The aim of reweighting is right-weighting, not down-weighting
Other comments on misspecification 1. George Box: All models are wrong [= misspecified], but some are useful 2. Don t add model structure that s not estimable 3. Possibility of over-fitting (e.g., time-varying selectivities) 4. The multinomial likelihood is a misspecification commonly overlooked (especially in simulation studies) p. 424 in Empirical Model-Building and Response Surfaces (1987) by G.E.P. Box and Norman R. Draper
Summary 1: Three data-weighting principles 1. Prioritise abundance data (get good fits) 2. Don t down-weight abundance data because they may be unrepresentative 3. For compositions: - reweight iteratively, allowing for correlations (the aim is right-weighting, not down-weighting)
Summary 2 Data conflict 1. Conflict amongst abundance data sets: - consider alternative models 2. Conflict involving compositions: - if possible, reduce misspecification (then reweight) Simulation studies - please simulate more realistic compositions


")