Debt Capacity in Financial Credit Analysis
Explore the importance of debt capacity analysis in credit risk management, which involves evaluating a company's ability to manage debt based on financial performance, industry dynamics, and structural risks.

Download Presentation

Please find below an Image/Link to download the presentation.
The content on the website is provided AS IS for your information and personal use only. It may not be sold, licensed, or shared on other websites without obtaining consent from the author. If you encounter any issues during the download, it is possible that the publisher has removed the file from their server.
You are allowed to download the files provided on this website for personal or commercial use, subject to the condition that they are used lawfully. All files are the property of their respective owners.
The content on the website is provided AS IS for your information and personal use only. It may not be sold, licensed, or shared on other websites without obtaining consent from the author.
E N D
Presentation Transcript
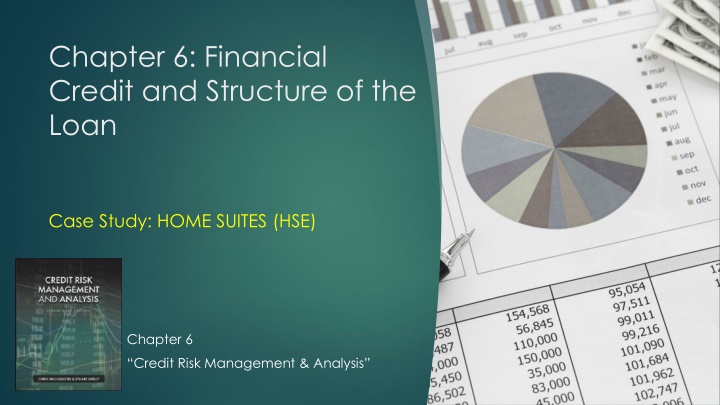
Chapter 6: Financial Credit and Structure of the Loan Case Study: HOME SUITES (HSE) Chapter 6 Credit Risk Management & Analysis
FINANCIAL STRUCTURE: AN OVERVIEW In performing their credit risk management and analysis, the credit analyst must first understand the operations of the enterprise as a going concern without debt. The first objective of the credit analyst is to develop a deep understanding of their borrowers operational dynamics, revenues, and expenses. The credit analyst should undertake a thorough review of the borrower s historical financial performance and trends. The credit analyst must incorporate their understanding of the company and compare its performance to the overall industry.
FINANCIAL STRUCTURE: AN OVERVIEW Once the credit analyst has undertaken a comprehensive company review, the next step is to determine how much debt the borrower can reasonably manage based on its financial performance, collateral, corporate structure, and industry dynamics. This analysis is called the establishment of the borrower s debt capacity, which is the amount of debt that the company can handle in various sensitivity scenarios. In the case of a leveraged buyout (LBO), the premise is that the investor is seeking as much debt as possible to enhance its returns, though too much debt could have other negative implications for all parties involved. Structuring the right amount of debt is the challenge. Independent rating agencies such as Standard & Poor s, Moody s, and Fitch focus on rating these debt facilities and the company (issuer of debt) is the amount of debt relative to their ability to repay it.
DEBT CAPACITY Debt capacity is the amount of financial leverage that the acquired company can support based on its future projected cash flows and its asset base. The future projected cash flows are generally provided to the lender by the borrower or an equity sponsor (a private equity (PE) firm), but in each case, the credit analyst must take an educated evaluation of the reasonableness and voracity of the company forecast to establish their best and most probable or most likely case for forecasted cash flows. In the case of an acquisition, or when discussing the value of an enterprise, it is common to frame the valuation in terms of an earnings before interest taxes, depreciation, and amortization (EBITDA) multiple. It is not surprising to understand that the same EBITDA multiple concept is used when referring to debt capacity.
DEBT CAPACITY The debt capacity of a company can be determined after thorough consideration of the market demand for a company s product, industry sensitivity, company-specific dynamics, and the structural risks associated with the company. For every company, and particularly in the case of an acquisition, the enterprise debt capacity is important because the lender needs to assure themselves that the company can support and maintain a certain amount of debt without the risk of default and potentially suffering a loss as a result. While a valuation of an enterprise and the participants in an industry can result in high EBITDA multiples, the debt capacity EBITDA multiple may be significantly lower. Enterprise value multiples may be driven by growth prospects and industry- and enterprise-specific dynamics. The enterprise debt capacity is driven by its collateral values and the predictable nature of its stable cash flows.
DEBT CAPACITY A highly predictable cash flow business, with high, stable, long-live predictable asset values, such as a utility, might have very high debt capacity multiples, while a less predictable business in the service industry may have a lower debt capacity EBITDA multiple, such as a consulting business. The first analysis the credit analyst must make in determining an enterprise debt capacity is a collateral review and specifically a working capital asset review. The collateral review would expand to the fixed assets, both tangible and intangible, such as chattel furniture fixtures, equipment, and real property. Once the credit analyst has conducted a thorough collateral analysis, they will perform the detailed financial performance analysis, consisting of historical financial statements review and forecasted cash flow analysis, using sensitivity scenarios. The credit analyst debt capacity analysis will culminate in determining what collateral debt capacity an enterprise has and thereafter what additional, if any, cash flow debt capacity the enterprise has or possibly cash flow debt capacity limitations it may have.
Structuring the Loan 1. Establish available working capital collateral Asset-based loan structure advance rates dependent on audit and operational capability of lender 1. Wholesale banking structure advance rates Maximum revolver and borrowing base Establish seasonality to provide a range of expectations of outstanding balance and costs of debt Transaction or immediate liquidity needs required reduces the amount of funding and debt capacity at closing 2. Establish term collateral Equipment market value, disposition costs, relocation costs, foreclosure costs Real property specialized versus homogeneous Determine term debt capacity and term debt maturity. 3. Combine collateral debt capacity from 1 and 2 above
Credit Analysis Basics 1. Revenue analysis Products Channels Unit volumes Pricing 2. Cost of goods sold (COGS) analysis Raw materials Work in progress Finished goods 3. Selling, General and Administrative (SG&A) expenses 4. Depreciation and amortization 5. Adjustments 6. EBITDA normalized, steady-state, predictable enterprise cash flow
TRANSACTION PROCESS AND ANALYSIS: AN OVERVIEW A company needs to decide either to raise equity or debt, or both, and that constitutes a transaction. Every transaction that involves accessing the capital markets for successful execution is unique. Whether a PE firm is tendering 100% of the shares of a publicly traded company or a company is seeking to merge with another company, the capital market raised has different shapes and sizes. The common goal, of course, is meeting or exceeding return expectation. Since each investor, debt, or equity that is participating in the transaction has different objectives, it is important that the transaction is structured to meet everyone s expectations.
ONE TRANSACTION, MULTIPLE EXPECTATIONS: THE ANALYSIS Basically, a transaction such as mergers and acquisitions (M&A) or an LBO include multiple parties that are needed for a successful execution such as Private, strategic, and public investors; Investment bankers and underwriters; Commercial bankers who provide bank loans; Bond investors; Target companies; Government regulators; and Rating agencies.
STRUCTURING THE TRANSACTION They are various steps to structuring an LBO. Investment banks that advise the PE investors typically consider the following: Measuring debt capacity. What is the maximum debt banks and bond holders, or mezzanine investors are willing to lend? Building a financial model that demonstrates how the debt will be serviced and how the PE investor will meet his or her expected return. The financial model will build top-line revenue growth for the acquisition target, cost and income margin assumptions, capital expenditures (Capex) that support the projected growth level, and interest rate assumptions for each type of debt. Build the equity cash flows, including a measurable terminal value and appropriate discount rates.
BUILDING THE MODEL AND TESTING THE DEBT REPAYMENT AND EQUITY RETURN USING EXCEL Building the Historical Analysis The first step is to collect all the company s historical financial information (10K and 10Q reports if the target is a publicly traded company) In an M&A or an LBO transaction, the sell-side adviser typically provides this information to interested buyers, which might also include industry reports, transaction specifics, and financial projections. Setting Up the M&A or LBO Transactions Sources and Uses Assumption of Purchase Price Use of Capital. The PE firm might hire an adviser (buy-side adviser) to assist them with the purchase price. In general, an experienced PE firm will use basic assumption first to run the numbers such as EBITDA purchase multiples. Assumption of Financing and Debt Repayment Source of Capital. The sources of capital are determined by the target company s debt capacity. Building the Projections All lines of the income, cash flow, and balance sheet statements need to be addressed in projecting them out.
CASE STUDY: HOME SUITES (HSE)
CASE STUDY: HOME SUITES (HSE) CASE STUDY: HOME SUITES (HSE) Back to the case study of Home Suites (HSE) from the end of Chapter 5. As part of the credit application, the deal team from Drou Bank Corporation ( DBC or Drou Bank ) needs to run an analysis based on the structure and terms of the deal, as well as test debt repayment capacity from base case and stress case. These parts are normally conducted by the more experienced senior analyst or associate of the deal team. Transaction Background SuperInv Group and AllStar Group (the Sponsors ) agreed to buy hotel operator Home Suites for $7.6 billion. The Sponsors cash offer of $22.50 per share represents a premium of 20% to HSE s share closing price on April 2. The total consideration will be funded by a split of 70% of equity injection from the Sponsors and 30% of debt financing with Bank A as the agent bank. The transaction is scheduled to close in November 2021. Drou Bank was invited by PE firm AllStar to participate in the transaction as a Join Lead Arranger ( JLA ) with $475 million commitments to bank debt ($100 million revolver, $175 million Term Loan A, $200 million Term Loan B). In addition, Drou Bank will also commit $198.75 million to the bridge loan facility, which will be taken down by subordinated corporate bonds upon closing of the LBO transaction.
CASE STUDY: HOME SUITES (HSE) TRANSACTION SOURCES & USES ( $ 000's) % of FY2020 EBITDAx FY2019 EBITDAx Stock Price ($) Shares Outstanding Sources Funded Uses Amount Total Cap Revolver ($400,000) Term Loan A Term Loan B Total Bank Debt Subordinated Bonds Total Debt 0.0% 9.2% 10.5% 19.7% 10.5% 30.2% Cash Purchase Price Refinance Debt Transaction Fees & Expenses 4,154,904 3,220,346 221,258 - 700,000 800,000 1,500,000 795,000 2,295,000 1.8x 2.1x 3.9x 2.1x 6.0x 1.2x 1.4x 2.6x 1.4x 4.0x 22.50 $ 184,662 3.00% Cash Equity Total Sources 5,301,508 7,596,508 69.8% 100.0% 13.9x 19.9x 9.2x 13.2x Total Uses 7,596,508 Acquisition Target 2020 (Covid) EBITDA = Acquisition Target 2019 (normal) EBITDA = 382,369 576,528 SOFR Rate/Floor= 1.00%
CASE STUDY: HOME SUITES (HSE) Home Suites (NYSE: HSE) Public to Private LBO Transaction TRANSACTION PRO FORMA CAPITALIZATION TABLE ($ 000's) FY2020 EBITDAx PF Closing (11/2021) FY2020 EBITDAx FY2019 EBITDAx As of FYE 2020 LBO Adj. Cash 564,995 Existing Debt Funded RC Term Loan A Term Loan B Total Bank Debt Corporate Bonds Total Debt Equity (Book Value) Total Capitatlization 3,220,346 3,220,346 1,061,094 4,281,440 3,220,346 (3,220,346) 700,000 800,000 (1,720,346) 795,000 (925,346) 4,240,414 3,315,068 1,500,000 2,295,000 5,301,508 7,596,508 - - - - - - 700,000 800,000 8.4x 3.9x 2.1x 6.0x 13.9x 19.9x 2.6x 1.4x 4.0x 9.2x 13.2x - 795,000 8.4x 2.8x 11.2x Acquisition Target 2020 (Covid) EBITDA = Acquisition Target 2019 (normal) EBITDA = 382,369 576,528
CASE STUDY: HOME SUITES (HSE) CREDIT APPLICATION TERMS AND CONDITIONS Borrower(s): Guarantor(s) Expected Closing Date: Sponsor(s): Agent (s) Facilities: Home Suites Inc (the Borrower ) Home Suites Holdings LLC ( Holdings ) 11/2021 SuperInv, AllStar (60%/40% ownership split) Admin Agent Bank (Left Lead): Topbank Bank NA RC $400,000,000 TL A $700.000,000 TL B $800,000,000 RC - working capital. TL A and TL B: to fund the LBO transaction Purpose of Loans:
CASE STUDY: HOME SUITES (HSE) CREDIT APPLICATION TERMS AND CONDITIONS Base Rate(s): Underwriting Fees / OID: Original Issue Discount (OID) Pricing Spread(s) SOFR (1% Floor) RC: 2.25, TL A: 2.25% TL B: 2.25% RC: 97.75 TL A: 97.75 TL B: 99.75% RC: L + 350 400 (50bps commitment) TL A: L + 350 400 TL B: L + 400 550 RC and TL A: 11/2026, TL B: 11/2028 TL B: 101 soft calls 6 months post-closing TL A: 5%, 10%, 10%, 15%, 15%, the Balance TL B: 1% anually for 6 years, remaining at maturity Maturities: Call Protections Amortization Schedule
CASE STUDY: HOME SUITES (HSE) Incremental Facilities $350,000,000 free-and-clear, plus amount subject to negative covenants Financial Covenant(s) Net senior secured leverage ratio at 4.25x with two step-downs to 3.25x, Net total leverage at 6.00x with two step-downs to 4.00x Equity Cure(s) Cap: two cures per four fiscal quarter period, five cures for life Affirmative Covenants Financial Statements, Certificates; Other Information Payment of Obligations, Taxes, Maintenance of Existence; Compliance Maintenance of Property; Insurance Inspection of Property; Books and Records; Discussions, Notices, Environmental Laws, Additional Collateral, Use of Proceeds, Know Your Customer, Further Assurances Leases, Post-Closing Requirements Negative Covenants Financial Condition Covenants, Indebtedness, Liens, Fundamental Changes Restricted Payments, Transactions With Affiliates, Certain Amendments Amendments to Other Loan Documents Regarding Debt Incurrence Events of Default Missed Interest or Principal Payment, Material Inaccurate in Representations and Warranties, Breach of Covenants ERISA Event, Cross-Default, Insolvency, Change of Control, Material Adverse change Mandatory Prepayments Subject to reinvestments or prepayment of loans: 100% proceeds from selling assets subject, 100% proceeds from equity investment
CASE STUDY: HOME SUITES (HSE) Excess Cash Sweep Starts at 50% with two step-downs: Step-down to 25% at 2.50x net first lien leverage ratio Step-down to 0% at 1.50x net first lien leverage ratio MFN: 50bps (no sunset) Others
CASE STUDY: HOME SUITES (HSE) CREDIT APPLICATION PROJECTIONS (BASE CASE) In an LBO transaction, the Sponsor usually provides an equity case that emphasizes the growth of the target company from the equity investor s perspective. Debt investors such as the banks care more about the borrower s debt repayment capacity and would run their own base case with more conservative assumptions. In the Home Suites LBO transaction, after receiving the equity case from the Sponsor, the deal team completes its own base case that focuses on the debt repayment capacity and covenant compliance over the life of the bank debt facilities.
CASE STUDY: HOME SUITES (HSE) BASE CASE ASSUMPTIONS INCOME STATEMENT The base case assumes an organic growth of 3% of average daily rate ( ADR, price charged per room) and revenue from franchised hotels, in line with expected GDP growth. The number of rooms is projected to grow at an annual rate of 2% as the Company gradually expands its hotel rooms. The occupancy rate is assumed to be back to the prior COVID-19 level in 2022 and stabilize at 80%. The base case also reduces COGS and operating expense as a percent of revenue as ADR is projected to increase and the Company will realize economies of scale and improve operating efficiencies over time. Depreciation and amortization as a percent of revenue are assumed to be at the same level as 2020 over the projection period. The tax rate is 34% per opinions from the management and accounting advisers.
CASE STUDY: HOME SUITES (HSE) BASE CASE ASSUMPTIONS CASH FLOW STATEMENT AND BALANCE SHEET STAT EMENT Capex and deferred taxes as a percent of revenue are projected at the historical average rate of 2016 2020. Cash related to working capital is calculated as changes reflected on the balance sheet as calculated by days of working capital items. AR days are assumed to be 5 days in 2021 and 6 days over the remaining years of the base case period, a slight increase from 4.87 days in 2020. The base case assumes the Company will loosen its collecting policy to stimulate sales. AP days are projected to reduce from 143.12 days in 2020 to 128.14, which is the prior COVID-19 level. The Company negotiated more favorable terms during the pandemic, but as business goes back to normal, the AP days will also fall back to the normal level.
HOME SUITES ("HSE") Base Case INPUT OPERATING ASSUMPTIONS PROJECTED INCOME STATEMENT ASSUMPTIONS Revenue Worksheet Assumptions Average Daily Rate (ADR) ADR Price Increase % Occupancy Rate RevPar Number of Rooms Increase % Revenue from Owned Hotels Revenue fron Frenchised Hotels Growth Total Revenue Dec-21 365.00 63.86 Dec-22 365.00 65.78 Dec-23 365.00 67.75 Dec-24 366.00 69.78 Dec-25 365.00 71.87 Dec-26 365.00 74.03 Dec-27 365.00 76.25 Dec-28 366.00 78.54 3.0% 61.0% 38.95 75,888 2.00% 1,079,008 230,451 3.00% 1,309,460 3.0% 75.0% 49.33 77,406 2.00% 1,393,778 237,365 3.00% 1,631,143 3.0% 80.0% 54.20 78,954 2.00% 1,561,923 244,486 3.00% 1,806,409 3.0% 80.0% 55.83 80,533 2.00% 1,645,452 251,821 3.00% 1,897,273 3.0% 80.0% 57.50 82,144 2.00% 1,723,989 259,375 3.00% 1,983,364 3.0% 80.0% 59.22 83,786 2.00% 1,811,223 267,156 3.00% 2,078,379 3.0% 80.0% 61.00 85,462 2.00% 1,902,871 275,171 3.00% 2,178,042 3.0% 80.0% 62.83 87,171 2.00% 2,004,633 283,426 3.00% 2,288,059 $ $ $ $ $ $ $ $ CASE STUDY: HOME SUITES (HSE) Cost of Revenue as % of Revenue Operating Expenses (excludind D&A) as % of Revenue Depreciation and Amortization (D&A) as % of Revenue Tax Rate 57.0% 12.5% 16.1% 34.0% 55.0% 11.7% 16.1% 34.0% 53.0% 11.0% 16.1% 34.0% 51.0% 10.2% 16.1% 34.0% 49.0% 10.2% 16.1% 34.0% 47.0% 10.2% 16.1% 34.0% 46.0% 10.2% 16.1% 34.0% 45.0% 10.2% 16.1% 34.0% CASH FLOW STATEMENT ASSUMPTIONS Capital Expenditures as % of Revenue Deferred Taxes as % of Taxes 15.6% 0.01% 15.6% 0.01% 15.6% 0.01% 15.6% 0.01% 15.6% 0.01% 15.6% 0.01% 15.6% 0.01% 15.6% 0.01% BALANCE SHEET ASSUMPTIONS Accounts Receivable Days Inventory Days Other Current Assets % of Revenues Accounts Payable Days Other Current Liabilities as % of Revenues OPERATING ASSUMPTIONS 143.12 5.00 - - 128.14 6.00 - - 128.14 6.00 - - 128.14 6.00 - - 128.14 6.00 - - 128.14 6.00 - - 128.14 6.00 - - 128.14 6.00 - - - - - - - - - -
HOME SUITES ("HSE") Base Case Transaction closing: 11/2021 DEBT SCHEDULE ASSUMPTIONS ($ 000's) Historical Dec-20 PROJECTED Dec-21 Dec-22 Dec-23 Dec-24 Dec-25 Dec-26 Dec-27 Dec-28 Interest Rate Assumptions SOFR Rate SOFR Iincrease / Decrease 0.60% 1.10% 0.5% 1.60% 0.5% 2.60% 1.0% 2.60% 0.0% 2.60% 0.0% 2.60% 0.0% 2.60% 0.0% 2.60% 0.0% Revolver Outstanding (unfunded) Outstanding (funded) Increase / (Decrease) Interest Payment Unfunded Fee Spread Interest rate COMMITMENT FUNDED AMOUNT 400,000 - 400,000 400,000 2,000 400,000 2,000 400,000 2,000 400,000 2,000 400,000 2,000 400,000 2,000 400,000 - - - - - - - - - - - - - - - - 167 0.5% 4.00% 5.10% 2,000 0.5% 4.00% 6.60% 0.5% 4.00% 5.60% 0.5% 4.00% 6.60% 0.5% 4.00% 6.60% 0.5% 4.00% 6.60% 0.5% 4.00% 6.60% 0.5% 4.00% 6.60% Term Loan A Outstanding Increase / (Decrease) Interest Payment Spread Interest rate 700,000 700,000 2,975 4.00% 5.10% 665,000 (35,000) 39,200 4.00% 5.60% 595,000 (70,000) 43,890 4.00% 6.60% 525,000 (70,000) 39,270 4.00% 6.60% 420,000 (105,000) 34,650 4.00% 6.60% (420,000) 25,410 4.00% 6.60% - - - - - - - CASE STUDY: HOME SUITES (HSE) - 4.00% 6.60% 4.00% 6.60% % Amort 5.00% 10.00% 10.00% 15.00% 60.00% Term Loan B Outstanding Increase / (Decrease) Interest Payment Spread Interest rate 800,000 800,000 4,400 5.50% 6.60% 792,000 (8,000) 56,800 5.50% 7.10% 784,000 (8,000) 64,152 5.50% 8.10% 776,000 (8,000) 63,504 5.50% 8.10% 768,000 (8,000) 62,856 5.50% 8.10% 760,000 (8,000) 62,208 5.50% 8.10% 752,000 (8,000) 61,560 5.50% 8.10% (752,000) 55,836 5.50% 8.10% - - % Amort 1.00% 1.00% 1.00% 1.00% 1.00% 1.00% 94.00% New Term Loan B (refinancing) Outstanding Increase / (Decrease) Interest Payment Spread Interest rate - - - - - - - - - - - - - - - - - - - - - - - - - 0.00% 0.00% 0.00% 0.00% 0.00% 0.00% 0.00% 0.00% 0.00% 0.00% 0.00% 0.00% 0.00% 0.00% 0.00% 0.00% % Amort 0.00% 0.00% 0.00% 0.00% 0.00% 0.00% 0.00% 0.00% Subordinated Bonds Outstanding Increase / (Decrease) Interest Payment Interest rate 795,000 795,000 5,963 9.00% 795,000 71,550 9.00% 795,000 71,550 9.00% 795,000 71,550 9.00% 795,000 71,550 9.00% 795,000 71,550 9.00% 795,000 71,550 9.00% 795,000 71,550 - - - - - - - - 9.00% Total Interest Payment Total Loan Principal Increase / (Decrease) Total Payment Total Senior Debt Total Debt Outstanding 1,900,000 2,695,000 13,504 169,550 (43,000) 126,550 1,857,000 2,652,000 181,592 (78,000) 103,592 1,779,000 2,574,000 176,324 (78,000) 98,324 1,701,000 2,496,000 171,056 (113,000) 58,056 1,588,000 2,383,000 161,168 (428,000) (266,832) 1,160,000 1,955,000 135,110 (8,000) 127,110 1,152,000 1,947,000 129,386 (752,000) (622,614) 400,000 1,195,000 - 13,504
HOME SUITES ("HSE") Base Case INCOME STATEMENT ($ 000's) PROJECTED Historical Dec-20 1,250,779 Dec-21 1,309,460 Dec-22 1,631,143 24.6% Dec-23 1,806,409 10.7% Dec-24 1,897,273 Dec-25 1,983,364 Dec-26 2,078,379 Dec-27 2,178,042 Dec-28 2,288,059 REVENUE Sales Growth 4.7% 5.0% 4.5% 4.8% 4.8% 5.1% COST OF SALES Gross Profit Gross Margin 712,512 538,267 43.0% 745,940 563,520 43.0% 896,565 734,578 45.0% 956,773 849,636 47.0% 966,954 930,319 49.0% 971,163 1,012,201 51.0% 976,120 1,102,259 53.0% 1,001,147 1,176,895 54.0% 1,028,836 1,259,223 55.0% Operating Expenses (excludind D&A) EBITDA % Sales 155,898 382,369 30.6% 163,631 399,889 30.5% 191,595 542,983 33.3% 198,634 651,002 36.0% 194,396 735,923 38.8% 203,217 808,984 40.8% 212,952 889,307 42.8% 223,164 953,731 43.8% 234,436 1,024,787 44.8% CASE STUDY: HOME SUITES (HSE) Depreciation and Amortization EBITA (A as Amortization of Transaction Fees) Amort. of Fees EBIT 211,388 188,500 31,608 156,892 263,318 279,664 31,608 248,056 291,612 359,390 31,608 327,782 306,280 429,643 31,608 398,035 320,178 488,806 31,608 457,198 335,517 553,790 31,608 522,182 351,605 602,126 31,608 570,518 369,366 655,421 Year Amort: 7 655,421 INTEREST EXPENSE (INCOME): Existing Debts Revolver Term Loan A Term Loan B New Term Loan B Subordinated Bonds Total Interest Expense 134,526 2,975 4,400 5,963 148,030 169,550 - 181,592 - 176,324 - 171,056 - 161,168 - 135,110 - - 167 2,000 39,200 56,800 2,000 43,890 64,152 2,000 39,270 63,504 2,000 34,650 62,856 2,000 25,410 62,208 2,000 - 61,560 2,000 - - - 71,550 73,550 - - - - - - - 71,550 71,550 71,550 71,550 71,550 71,550 EBT Taxes Tax Rate Tax Expense NET INCOME (LOSS) 8,863 34.0% 3,013 5,849 78,506 34.0% 26,692 51,814 146,190 34.0% 49,705 96,485 221,711 34.0% 75,382 146,329 286,142 34.0% 97,288 188,853 361,014 34.0% 122,745 238,269 435,408 34.0% 148,039 287,369 581,871 34.0% 197,836 384,035
HOME SUITES ("HSE") Base Case CASH FLOW STATEMENT ($ 000's) PROJECTED Dec-21 248,846 Dec-22 51,814 263,318 31,608 346,742 Dec-23 96,485 291,612 31,608 419,709 Dec-24 146,329 306,280 31,608 484,222 Dec-25 188,853 320,178 31,608 540,646 Dec-26 238,269 335,517 31,608 605,401 Dec-27 287,369 351,605 31,608 670,591 Dec-28 384,035 369,366 753,412 Net Income (Loss) Depreciation and Amortization Amortization of Fees Deffered Taxes Cash Income (CI) 5,849 211,388 31,608 - 0 2 3 4 6 7 9 12 WORKING CAPITAL ACTIVITIES: Change in Accounts Receivable Change in Inventory Change in Other Current Assets Change in Accounts Payable Change in other Current Liabilities Total Working Capital Activities (11,339) (12,826) (1,487) (8,876) (2,881) (1,408) (1,500) (1,562) (1,638) (1,706) - - - - - - - - - - - - - - - - 22,255 21,137 2,647 2,405 1,740 8,786 8,734 CASE STUDY: HOME SUITES (HSE) - - - - - - - - 13,379 18,256 1,238 905 178 7,148 7,028 Operating Cash Flow (OCF) 236,020 360,121 437,964 485,460 541,550 605,580 677,739 760,441 INVESTMENT ACTIVITIES: Capital Expenditures Investments in the JV Total Investment Activivites (203,635) (203,635) (253,660) (253,660) (280,916) (280,916) (295,046) (295,046) (308,434) (308,434) (323,210) (323,210) (338,708) (338,708) (355,817) (355,817) - - - - - - - - Cash Available for Debt Service (CAFDS) Accumulated CAFDS CAFDS as a % of Bank Debt at Transaction Closing CAFDS as a % of Total Debt at Transaction Closing 32,385 32,385 2.2% 1.4% 106,462 138,847 9.3% 6.0% 157,049 295,896 19.7% 12.9% 190,414 486,310 32.4% 21.2% 233,117 719,427 48.0% 31.3% 282,370 1,001,797 339,031 1,340,828 404,623 1,745,451 116.4% 66.8% 43.7% 89.4% 58.4% 76.1% FINANCING ACTIVITIES (PMTs/Borrowings): Revolver Term Loan A Term Loan B New Term Loan B Subordinated Bonds Total Debt Payments - - - - - - - - (105,000) (8,000) (113,000) - (420,000) (8,000) (428,000) - - - (752,000) (752,000) - - (35,000) (8,000) (70,000) (8,000) (70,000) (8,000) (8,000) - - (8,000) - - - - - - - - - - - - - (43,000) (78,000) (78,000) Equity Contribution Total Financing Activivites - - (43,000) - (78,000) - (78,000) - (113,000) - (428,000) - - (8,000) (752,000) Net Change in Cash Beginning Cash Ending Cash 32,385 564,995 597,380 63,462 597,380 660,842 79,049 660,842 739,891 112,414 739,891 852,305 120,117 852,305 972,422 (145,630) 972,422 826,792 331,031 826,792 1,157,822 (347,377) 1,157,822 810,446
Home Suites ("HSE") Base Case BALANCE SHEET Pre- Post - Debit Credit PROJECTED Transaction Dec-20 Transaction Dec-20 ($ 000's) Dec-21 Dec-22 Dec-23 Dec-24 Dec-25 Dec-26 Dec-27 Dec-28 Current Assets Cash Accounts Receivable Inventory Other Current Assets Total Current Assets 581,446 564,995 16,451 581,446 564,995 16,451 597,380 17,938 615,318 660,842 26,813 687,655 739,891 29,694 769,585 852,305 31,103 883,408 972,422 32,603 1,005,025 826,792 34,165 860,957 1,157,822 35,803 1,193,626 810,446 37,509 847,955 - - - - - - - - - - - - - - - - - - - - Goodwill & Other Intagibles Capitalized Fees Tangible Assets LTI & Other Assets Total Assets 4,135,146 95,410 4,906,979 94,978 3,093,810 221,258 3,188,788 221,258 4,135,146 95,410 8,222,046 3,188,788 189,649 4,127,392 95,410 8,216,557 3,188,788 158,041 4,117,734 95,410 8,247,627 3,188,788 126,433 4,107,037 95,410 8,287,252 3,188,788 94,825 4,095,803 95,410 8,358,232 3,188,788 63,216 4,084,058 95,410 8,436,497 3,188,788 31,608 4,071,751 95,410 8,248,514 3,188,788 4,058,854 95,410 8,536,677 3,188,788 4,045,306 95,410 8,177,458 - - - CASE STUDY: HOME SUITES (HSE) Current Liabilities Accounts Payable Other Current Liabilities Total Current Liabilities 303,838 303,838 303,838 303,838 292,498 292,498 314,753 314,753 335,890 335,890 338,537 338,537 340,942 340,942 342,682 342,682 351,468 351,468 360,202 360,202 - - - - - - - - - - Existing Long Term Debt Revolver Term Loan A Term Loan B New Term Loan B Subordinated Bonds Total Debt 3,220,346 3,220,346 700,000 800,000 - - 700,000 800,000 795,000 2,295,000 - - 665,000 792,000 795,000 2,252,000 - - 595,000 784,000 795,000 2,174,000 - - 525,000 776,000 795,000 2,096,000 - - 420,000 768,000 795,000 1,983,000 - - 760,000 795,000 1,555,000 - - - 752,000 795,000 1,547,000 - - - 795,000 795,000 - - - - - - - - 700,000 800,000 - - - - - - - - 3,220,346 - 795,000 795,000 2,295,000 Other Liabilities / Deferred Taxes Total Liabilities 321,701 3,845,885 321,701 2,920,538 321,701 2,909,199 321,703 2,888,456 321,706 2,831,596 321,710 2,756,247 321,716 2,645,658 321,723 2,219,405 321,732 2,220,200 321,744 1,476,946 Shareholder's Equity Common Stock Other Equity Retained Earnings Total Shareholder's Equity 1,112,560 (53,597) 1,061,094 2,131 1,112,560 (53,597) 2,131 5,301,508 5,301,508 5,301,508 5,301,508 5,849 5,307,357 5,301,508 57,663 5,359,171 5,301,508 154,149 5,455,657 5,301,508 300,478 5,601,986 5,301,508 489,331 5,790,839 5,301,508 727,600 6,029,108 5,301,508 1,014,969 6,316,477 5,301,508 1,399,004 6,700,512 - - - - - - - - - - Total Liabilities & Equity 4,906,979 7,596,508 7,596,508 8,222,046 8,216,557 8,247,627 8,287,252 8,358,232 8,436,497 8,248,514 8,536,677 8,177,458
CASE STUDY: HOME SUITES (HSE) HOME SUITES ("HSE") Base Case SUMMARY INFO & CREDIT ANALYSIS Dec-21 Dec-22 Dec-23 Dec-24 Dec-25 Dec-26 Dec-27 Dec-28 Coverage Ratio EBITDA/ Interest Covenant EBITDA Cushion ($ 000's)* 2.70x 2.00x 3.20x 2.00x 3.58x 2.00x 4.17x 2.00x 4.73x 2.00x 5.52x 2.00x 7.06x 2.00x 13.93x 2.00x (877,687) (103,829) (203,883) (287,818) (383,275) (466,872) (566,971) (683,511) Senior Leverage Ratio Senior Secured Debt / EBITDA Net Senior Secured Debt / EBITDA Covenant (Net Senior Secured Leverage Ratio) EBITDA Cushion ($ 000's)* 3.75x 2.26x 4.25x 2.68x 1.47x 4.25x 2.12x 0.98x 3.75x 1.77x 0.61x 3.75x 1.47x 0.27x 3.25x 0.85x 0.00x 3.25x 0.79x 0.00x 3.25x 0.00x 0.00x 3.25x (187,508) (355,651) (480,573) (616,271) (742,652) (909,858) (1,078,600) (1,274,155) Total Leverage Ratio Total Debt / EBITDA Net Total Debt / EBITDA Covenant (Net Total Leverage Ratio) EBITDA Cushion ($ 000's)* 5.74x 4.25x 6.00x 4.15x 2.93x 6.00x 3.34x 2.20x 5.00x 2.85x 1.69x 5.00x 2.45x 1.25x 4.00x 1.75x 0.82x 4.00x 1.62x 0.41x 4.00x 0.78x 0.00x 4.00x (116,952) (277,790) (364,180) (487,184) (556,339) (707,255) (856,437) (1,028,648) Total Debt / Total Capitalization * How much the EBITDA has to drop before the company violates the covenant 30.2% 29.6% 28.5% 27.2% 25.5% 20.5% 19.7% 10.6%
CASE STUDY: HOME SUITES (HSE) BASE CASE RESULTS The income statement and cash flow statement results show that the borrower s business will continue to recover post-closing of the LBO transaction and show stable organic growth after 2023. Operating margins also improve over the period. The base case cash flow results also demonstrate the business s strong cash flow generating ability.In 2028, accumulated cash available for debt service (CAFDS) covers 116.4% of the total bank debt and 76.1% of the total debt. Cash position also steadily increases over the base case period, except for 2026 and 2028, as the Company needs to pay down the entire Term Loan A and Term Loan B upon maturity.
CASE STUDY: HOME SUITES (HSE) STRESS CASE ASSUMPTIONS INCOME STATEMENT To test the borrower s performance during the downturn, the stress case assumes a recession scenario in 2024: ADR drops by 15% (vs. 13.3% during COVID-19), the occupancy rate drops from 80% to 55% (vs. 73% to 61% during COVID-19), no growth in numbers of rooms and no growth in revenue from franchised hotels (vs. growth during COVID-19). A moderate recovery is assumed afterward. COGS and operating expenses as a percent of revenue are also projected to increase during the recession year to further pressure the margins. Depreciation and amortization as a percent of revenue are assumed to be at the same level as 2020 over the projection period. The tax rate is 34% per opinions from the management and accounting advisers.
CASE STUDY: HOME SUITES (HSE) STRESS CASE ASSUMPTIONS CASH FLOW STATEMENT AND BALANCE SHEET STAT EMENT Capex and deferred taxes as a percent of revenue are projected to be the same prior to the projected recession year. In 2024, as the revenue and profits start to decline, the stress case assumes the management would cut or postpone Capex to save cash. Capex is projected to increase as a percent of revenue as the business starts to recover. Cash related to working capital is calculated as changes reflected on the balance sheet as calculated by days of working capital items. AR days are assumed to increase over the stress case period as management continues efforts to stimulate growth by offering longer credit period terms to customers. AP days are projected to reduce from 143.12 days in 2020 to 128.14, which is the prior COVID-19 level in 2022 and 2023. The Company negotiated more favorable terms during the pandemic but as business goes back to normal, the AP days will also fall back to the normal level. After the assumed recession hits the business in 2024, AP days are projected to increase agai
HOME SUITES ("HSE") Stress Case Transaction closing: 11/2021 DEBT SCHEDULE ASSUMPTIONS ($ 000's) Historical Dec-20 PROJECTED Dec-21 Dec-22 Dec-23 Dec-24 Dec-25 Dec-26 Dec-27 Dec-28 Interest Rate Assumptions SOFR Rate SOFR Iincrease / Decrease 0.60% 1.10% 0.5% 1.60% 0.5% 2.60% 1.0% 2.60% 0.0% 2.60% 0.0% 2.60% 0.0% 2.60% 0.0% 2.60% 0.0% Revolver Outstanding (unfunded) Outstanding (funded) Increase / (Decrease) Interest Payment Unfunded Fee Spread Interest rate COMMITMENT FUNDED AMOUNT 400,000 - 400,000 400,000 2,000 400,000 2,000 400,000 2,000 400,000 2,000 400,000 2,000 400,000 2,000 400,000 - - - - - - - - - - - - - - - - 167 0.5% 4.00% 5.10% 2,000 0.5% 4.00% 6.60% 0.5% 4.00% 5.60% 0.5% 4.00% 6.60% 0.5% 4.00% 6.60% 0.5% 4.00% 6.60% 0.5% 4.00% 6.60% 0.5% 4.00% 6.60% Term Loan A Outstanding Increase / (Decrease) Interest Payment Spread Interest rate 700,000 700,000 2,975 4.00% 5.10% 665,000 (35,000) 39,200 4.00% 5.60% 595,000 (70,000) 43,890 4.00% 6.60% 525,000 (70,000) 39,270 4.00% 6.60% 420,000 (105,000) 34,650 4.00% 6.60% (420,000) 25,410 4.00% 6.60% - - - - - - - CASE STUDY: HOME SUITES (HSE) - 4.00% 6.60% 4.00% 6.60% % Amort 5.00% 10.00% 10.00% 15.00% 60.00% Term Loan B Outstanding Increase / (Decrease) Interest Payment Spread Interest rate 800,000 800,000 4,400 5.50% 6.60% 792,000 (8,000) 56,800 5.50% 7.10% 784,000 (8,000) 64,152 5.50% 8.10% 776,000 (8,000) 63,504 5.50% 8.10% 768,000 (8,000) 62,856 5.50% 8.10% (768,000) 62,208 5.50% 8.10% - - - - - - - - 5.50% 8.10% 5.50% 8.10% % Amort 1.00% 1.00% 1.00% 1.00% 1.00% 1.00% 94.00% New Term Loan B (refinancing) Outstanding Increase / (Decrease) Interest Payment Spread Interest rate - - - - - - - - - - - - - - - - 700,000 700,000 66,500 5.50% 9.50% 693,000 (7,000) 66,500 5.50% 9.50% 686,000 (7,000) 65,835 5.50% 9.50% 5.50% 9.50% 5.50% 9.50% 5.50% 9.50% 5.50% 9.50% 5.50% 9.50% % Amort 0.00% 0.00% 0.00% 0.00% 0.00% 0.00% 1.00% 1.00% Subordinated Bonds Outstanding Increase / (Decrease) Interest Payment Interest rate 795,000 795,000 5,963 9.00% 795,000 71,550 9.00% 795,000 71,550 9.00% 795,000 71,550 9.00% 795,000 71,550 9.00% 795,000 71,550 9.00% 795,000 71,550 9.00% 795,000 71,550 - - - - - - - - 9.00% Total Interest Payment Total Loan Principal Increase / (Decrease) Total Payment Total Senior Debt Total Debt Outstanding 1,900,000 2,695,000 13,504 169,550 (43,000) 126,550 1,857,000 2,652,000 181,592 (78,000) 103,592 1,779,000 2,574,000 176,324 (78,000) 98,324 1,701,000 2,496,000 171,056 (113,000) 58,056 1,588,000 2,383,000 227,668 (488,000) (260,332) 1,100,000 1,895,000 140,050 (7,000) 133,050 1,093,000 1,888,000 139,385 (7,000) 132,385 1,086,000 1,881,000 - 13,504
HOME SUITES ("HSE") Stress Case INCOME STATEMENT ($ 000's) PROJECTED Historical Dec-20 1,250,779 Dec-21 1,309,460 Dec-22 1,631,143 24.6% Dec-23 1,806,409 10.7% Dec-24 1,159,735 -35.8% Dec-25 1,074,258 Dec-26 1,431,961 33.3% Dec-27 1,484,775 Dec-28 1,558,265 REVENUE Sales Growth 4.7% -7.4% 3.7% 4.9% COST OF SALES Gross Profit Gross Margin 712,512 538,267 43.0% 640,155 669,304 51.1% 797,417 833,726 51.1% 883,099 923,310 51.1% 695,841 463,894 40.0% 537,129 537,129 50.0% 700,043 731,918 51.1% 725,862 758,913 51.1% 761,789 796,476 51.1% Operating Expenses (excludind D&A) EBITDA % Sales 155,898 382,369 30.6% 163,631 505,673 38.6% 203,829 629,897 38.6% 225,730 697,580 38.6% 200,724 263,170 22.7% 139,653 397,475 37.0% 171,835 560,083 39.1% 178,173 580,740 39.1% 186,992 609,484 39.1% CASE STUDY: HOME SUITES (HSE) Depreciation and Amortization EBITA (A as Amortization of Transaction Fees) Amort. of Fees EBIT 167,083 338,591 31,608 306,982 208,128 421,769 31,608 390,161 230,492 467,088 31,608 435,480 147,978 115,192 31,608 83,584 137,072 260,404 31,608 228,796 182,713 377,370 31,608 345,762 189,452 391,288 31,608 359,680 198,829 410,655 Year Amort: 7 410,655 INTEREST EXPENSE (INCOME): Existing Debts Revolver Term Loan A Term Loan B New Term Loan B Subordinated Bonds Total Interest Expense 134,526 2,975 4,400 5,963 148,030 169,550 - 181,592 - 176,324 - 171,056 - 227,668 - 140,050 - 139,385 - 167 2,000 39,200 56,800 2,000 43,890 64,152 2,000 39,270 63,504 2,000 34,650 62,856 2,000 25,410 62,208 66,500 71,550 2,000 - - 66,500 71,550 2,000 - - 65,835 71,550 - - - - - 71,550 71,550 71,550 71,550 EBT Taxes Tax Rate Tax Expense NET INCOME (LOSS) 158,953 34.0% 54,044 104,909 220,611 34.0% 75,008 145,603 253,888 34.0% 86,322 167,566 (92,740) 34.0% (31,532) (61,209) 57,740 34.0% 19,631 38,108 118,094 34.0% 40,152 77,942 219,630 34.0% 74,674 144,956 271,270 34.0% 92,232 179,038
HOME SUITES ("HSE") Stress Case CASH FLOW STATEMENT ($ 000's) PROJECTED Dec-21 104,909 167,083 31,608 303,603 Dec-22 145,603 208,128 31,608 385,344 Dec-23 167,566 230,492 31,608 429,671 Dec-24 (61,209) 147,978 31,608 118,376 Dec-25 38,108 137,072 31,608 206,789 Dec-26 77,942 182,713 31,608 292,266 Dec-27 144,956 189,452 31,608 366,020 Dec-28 179,038 198,829 377,873 Net Income (Loss) Depreciation and Amortization Amortization of Fees Deffered Taxes Cash Income (CI) - 3 4 5 (2) 1 2 4 5 WORKING CAPITAL ACTIVITIES: Change in Accounts Receivable Change in Inventory Change in Other Current Assets Change in Accounts Payable Change in other Current Liabilities Total Working Capital Activities (52,819) (54,306) (1,487) (8,876) (2,881) (24,845) (17,331) 7,514 (64,443) (65,808) (1,365) (7,840) (17,726) (18,883) (1,158) (1,517) - - - - - - - - - - - - - - - - CASE STUDY: HOME SUITES (HSE) 28,927 30,080 53,525 11,962 - - - - - - - - 20,052 27,199 45,685 10,444 Operating Cash Flow (OCF) 249,296 405,396 456,870 101,045 140,981 337,951 347,137 388,317 INVESTMENT ACTIVITIES: Capital Expenditures Investments in the JV Total Investment Activivites (203,635) (203,635) (253,660) (253,660) (280,916) (280,916) (69,584) (69,584) (64,455) (64,455) (114,557) (114,557) (178,173) (178,173) (202,574) (202,574) - - - - - - - - Cash Available for Debt Service (CAFDS) Accumulated CAFDS CAFDS as a % of Bank Debt at Transaction Closing CAFDS as a % of Total Debt at Transaction Closing 45,662 45,662 3.0% 2.0% 151,736 197,398 13.2% 8.6% 175,955 373,353 24.9% 16.3% 31,461 404,813 27.0% 17.6% 76,526 481,339 32.1% 21.0% 223,394 704,733 47.0% 30.7% 168,964 873,697 58.2% 38.1% 185,743 1,059,440 70.6% 46.2% FINANCING ACTIVITIES (PMTs/Borrowings): Revolver Term Loan A Term Loan B New Term Loan B Subordinated Bonds Total Debt Payments - - - - - - - - (105,000) (8,000) (113,000) - (420,000) (768,000) 700,000 (488,000) - - - - - - - (35,000) (8,000) (70,000) (8,000) (70,000) (8,000) - - - - - - - - (7,000) - (7,000) (7,000) - (7,000) - - (43,000) (78,000) (78,000) Equity Contribution Total Financing Activivites - - (43,000) - (78,000) - (78,000) - (113,000) - (488,000) - - (7,000) (7,000) Net Change in Cash Beginning Cash Ending Cash 45,662 564,995 610,656 108,736 610,656 719,393 97,955 719,393 817,347 (46,539) 817,347 770,808 (36,474) 770,808 734,334 (264,606) 734,334 469,728 161,964 469,728 631,692 178,743 631,692 810,435
Home Suites ("HSE") Stress Case BALANCE SHEET Pre- Post - Debit Credit PROJECTED Transaction Dec-20 Transaction Dec-20 ($ 000's) Dec-21 Dec-22 Dec-23 Dec-24 Dec-25 Dec-26 Dec-27 Dec-28 Current Assets Cash Accounts Receivable Inventory Other Current Assets Total Current Assets 581,446 564,995 16,451 581,446 564,995 16,451 610,656 17,938 628,594 719,393 26,813 746,206 817,347 29,694 847,042 770,808 22,181 792,989 734,334 23,545 757,879 469,728 31,385 501,114 631,692 32,543 664,235 810,435 34,060 844,496 - - - - - - - - - - - - - - - - - - - - Goodwill & Other Intagibles Capitalized Fees Tangible Assets LTI & Other Assets Total Assets 4,135,146 95,410 4,906,979 94,978 3,093,810 221,258 3,188,788 221,258 4,135,146 95,410 8,222,046 3,188,788 189,649 4,171,698 95,410 8,274,139 3,188,788 158,041 4,217,230 95,410 8,405,674 3,188,788 126,433 4,267,653 95,410 8,525,325 3,188,788 94,825 4,189,259 95,410 8,361,270 3,188,788 63,216 4,116,643 95,410 8,221,936 3,188,788 31,608 4,048,487 95,410 7,865,406 3,188,788 4,037,208 95,410 7,985,640 3,188,788 4,040,953 95,410 8,169,645 - - - CASE STUDY: HOME SUITES (HSE) Current Liabilities Accounts Payable Other Current Liabilities Total Current Liabilities 303,838 303,838 303,838 303,838 251,018 251,018 279,946 279,946 310,026 310,026 285,181 285,181 220,738 220,738 274,263 274,263 256,537 256,537 268,499 268,499 - - - - - - - - - - Existing Long Term Debt Revolver Term Loan A Term Loan B New Term Loan B Subordinated Bonds Total Debt 3,220,346 3,220,346 700,000 800,000 - - 700,000 800,000 795,000 2,295,000 - - 665,000 792,000 795,000 2,252,000 - - 595,000 784,000 795,000 2,174,000 - - 525,000 776,000 795,000 2,096,000 - - 420,000 768,000 795,000 1,983,000 - - 700,000 795,000 1,495,000 - - - - 693,000 795,000 1,488,000 - - - - 686,000 795,000 1,481,000 - - - - - - - 700,000 800,000 - - - - - - 3,220,346 - 795,000 795,000 2,295,000 Other Liabilities / Deferred Taxes Total Liabilities 321,701 3,845,885 321,701 2,920,538 321,704 2,867,722 321,708 2,853,654 321,714 2,805,739 321,712 2,702,893 321,713 2,525,451 321,715 2,090,979 321,720 2,066,257 321,725 2,071,224 Shareholder's Equity Common Stock Other Equity Retained Earnings Total Shareholder's Equity 1,112,560 (53,597) 1,061,094 2,131 1,112,560 (53,597) 2,131 5,301,508 5,301,508 5,301,508 5,301,508 104,909 5,406,417 5,301,508 250,512 5,552,020 5,301,508 418,078 5,719,586 5,301,508 356,869 5,658,377 5,301,508 394,977 5,696,485 5,301,508 472,919 5,774,427 5,301,508 617,875 5,919,383 5,301,508 796,913 6,098,421 - - - - - - - - - - Total Liabilities & Equity 4,906,979 7,596,508 7,596,508 8,222,046 8,274,139 8,405,674 8,525,325 8,361,270 8,221,936 7,865,406 7,985,640 8,169,645
CASE STUDY: HOME SUITES (HSE) HOME SUITES ("HSE") Stress Case SUMMARY INFO & CREDIT ANALYSIS Dec-21 Dec-22 Dec-23 Dec-24 Dec-25 Dec-26 Dec-27 Dec-28 Coverage Ratio EBITDA/ Interest Covenant EBITDA Cushion ($ 000's)* 3.42x 2.00x 3.72x 2.00x 3.84x 2.00x 1.49x 2.00x 89,478 2.32x 2.00x 2.46x 2.00x 4.15x 2.00x 4.37x 2.00x (209,614) (290,797) (334,396) (55,363) (104,747) (300,640) (330,714) Senior Leverage Ratio Senior Secured Debt / EBITDA Net Senior Secured Debt / EBITDA Covenant (Net Senior Secured Leverage Ratio) EBITDA Cushion ($ 000's)* 2.97x 1.76x 4.25x 2.31x 1.17x 4.25x 1.98x 0.81x 3.75x 4.94x 2.01x 3.75x 2.99x 1.14x 3.25x 1.25x 0.41x 3.25x 1.19x 0.11x 3.25x 1.13x 0.00x 3.25x (296,416) (456,343) (547,806) (121,786) (257,886) (704,615) (775,107) (858,849) Total Leverage Ratio Total Debt / EBITDA Net Total Debt / EBITDA Covenant (Net Total Leverage Ratio) EBITDA Cushion ($ 000's)* 4.54x 3.33x 6.00x 3.58x 2.43x 6.00x 3.12x 1.94x 5.00x 7.96x 5.04x 5.00x 1,868 4.99x 3.14x 4.00x 2.67x 1.83x 4.00x 2.56x 1.47x 4.00x 2.43x 1.10x 4.00x (224,949) (374,463) (426,249) (85,309) (303,765) (366,663) (441,843) Total Debt / Total Capitalization * How much the EBITDA has to drop before the company violates the covenant 29.8% 28.9% 27.5% 27.0% 25.8% 20.6% 20.1% 19.5%
CASE STUDY: HOME SUITES (HSE) STRESS CASE RESULTS The income statement and cash flow statement results show that even though the borrower s business would decline during the assumed recession period, the Company would still manage to meet the debt obligations and generate positive cash flow from operating activities. After refinancing Term Loan B, the borrower would be able to maintain adequate liquidity. The base case cash flow results also show that the accumulated CAFDS covers 70.6% of the total bank debt amounts and 46.2% of the total debt amounts. And the borrower would still be able to pay down the entire Term Loan A at maturity. Senior leverage ratio and total leverage ratio of the borrower will peak at 7.96x and 4.94x, respectively, in 2024 because of deteriorated operating results during the assumed recession. Net senior leverage ratio would remain below the financial covenant levels. The net total leverage ratio, however, would break the covenant in 2024, and the Sponsors would need to execute a one-time equity cure to inject additional equity to remain in compliance with the financial covenant set in the credit agreement. As the growth resumes in later years of the stress case, leverage ratios would drop again. The EBITDA/interest coverage covenant set by the deal team would be violated in 2024. However, given the cash position in 2024, the borrow would still be able to make debt payments.


")
")
")
")
")
")
")
")
")
")
")
")
")
")
")
")
")
")
")
")
")
")
")
")
")