Deciding New Features with Kano Model Technique
The Kano Model assists in determining which new features to add to a product based on customer satisfaction and cost considerations. It categorizes attributes into Threshold, Performance, and Excitement, guiding prioritization and decision-making for product upgrades. By understanding customer needs and emotions, businesses can enhance satisfaction and competitiveness while managing costs effectively.

Download Presentation

Please find below an Image/Link to download the presentation.
The content on the website is provided AS IS for your information and personal use only. It may not be sold, licensed, or shared on other websites without obtaining consent from the author.If you encounter any issues during the download, it is possible that the publisher has removed the file from their server.
You are allowed to download the files provided on this website for personal or commercial use, subject to the condition that they are used lawfully. All files are the property of their respective owners.
The content on the website is provided AS IS for your information and personal use only. It may not be sold, licensed, or shared on other websites without obtaining consent from the author.
E N D
Presentation Transcript
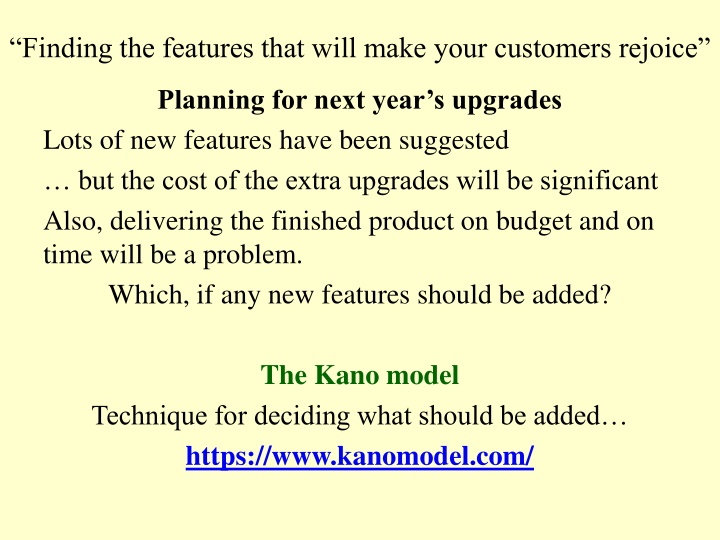
Finding the features that will make your customers rejoice Planning for next year s upgrades Lots of new features have been suggested but the cost of the extra upgrades will be significant Also, delivering the finished product on budget and on time will be a problem. Which, if any new features should be added? The Kano model Technique for deciding what should be added https://www.kanomodel.com/
The Kano Model a product or service is much more that just functionality. It s about customers emotions. His example all customers who buy a car expect it to stop when they hit the brakes, but many will be delighted by it voice- activated parking-assist system. a product or service is about much more than just it functionality. The model encourages thinking about customers needs. The switch from a more is always better approach to a less is more approach
The Kano Model introducing new features to a product can be expensive and may add complexity without any boosting customer satisfaction. also, adding a particular attractive feature could delight customer and increase sales without costing more. How?
The Kano Model The model assigns three types of attributes to a product or services. 1. Threshold Attributes (which a basic). Basic features are what customers expect His hotel example: When you book into a hotel, you expect hot water and a bed with clean linen as an absolute minimum. 2. Performance Attributes (satisfiers) not absolutely necessary, but they increase a customer s enjoyment of the service 3. Excitement Attributes (delighters) surprise elements that can really boost your product s competitive edge. Features that customers don t even know they want, but ar delighted with when they find them.
Chapter 11: Prioritizing Desirability Example: was the hotel room & it s group of features Must-haves: bed, bathroom, desk, clean The more, the better: comfort of bed, size of the room, variety and quantity of equipment in the fitness center Exciting: built-in TVs on the treadmills, free bottle of water in the room each day
Noriaki Kano Educator, lecturer, writer and consultant in the field of Quality Management Kano s Customer Satisfaction Model A simple ranking scheme that distinguishes between essential and differentiating attributes effecting customer quality and satisfaction The Kano model has turned traditional ideas into new insights about the actual value of a product Noriaki Kano believed that users (customers) do not value all product or service performance features the same way and that some features create higher levels of customer satisfaction (and loyalty) than others.
Noriaki Kano Separates Features into 3 Categories 1. Threshold or must-have features Features that customers expect a product or service to have 2. Linear features the more, the better , satisfaction positively correlated with quantity and quality of the features provided 3. Exciters and Delighters Features that provide great satisfaction and can boost the product s competitive edge Note: the lack of an Exciter or Delighter features does not decrease customer satisfaction below neutral
http://www.processgps.com/wp-content/uploads/2010/03/Kano-11-1024x758.pnghttp://www.processgps.com/wp-content/uploads/2010/03/Kano-11-1024x758.png More is better Didn t know I wanted It, but I like it Didn t know I wanted It, but I like it. Linear Feature Presence Must Have (basic requirements) Spoken Needs Another version of the Kano Model
Emphasis Must-have features are requiredfor a product to be marketable Users consider these to be mandatory Enough to be adequate beyond some point additional features do not add to customer satisfaction Completingas many linear functions as possible Each leads to greater customer satisfaction (although there is a limit don t bloat the product with too many At least a few delighters should be provided Note Features tend to migrate down the Kano Diagram over time. Example: not too long ago wireless internet access was a delighter, now it s a linear feature (becoming a threshold feature a have it, or elsefeature)
Kano: Assessing the type of each Theme By surveying customers and asking two questions 1. How does the customer feels if the feature is present? Functional form of the question 2. How does the customer feels if the feature is not present? Dysfunctional form of the question Each of the two types of questions are answered using a five-point scale: 1.I expect it to be that way 2.I like it that way 3.I am neutral 4.I can live with it that way 5.I dislike it that way SwimStat website See list of 3 features (Table 11.1, page 117) See list of survey questions (page 115)
SwimStats website Intent is to add 3 new features is proposed: 1. The ability to see a graph of a swimmer s times in an event over the past season. 2. The ability for swimmers to post autobiographical profiles 3. The ability for any registered site member to upload pictures Survey prospective users to determine the type of each feature FunctionalandDysfunctional forms of a question Figure 11.2
Determining the category of a feature ask two questions The functional form how the user would feel if the feature was present in the product The dysfunctional form how the user would feel if the feature was not present Answered using the same 5 POINT scale: 1. I expect it to be that way. 2. I like it that way. 3. I am neutral. 4. I can live with it that way. 5. I dislike it that way.
Survey each question is answered using the 5 point scale 1. 2. 3. 4. 5. I like it that way I expect it to be that way I am neutral I can live with it that way I dislike it that way Survey user s reactions (page 115): 1. If you cangraph a swimmer s time in an event over the past season, how do you feel 2. If you cannotgraph a swimmer s time in an event over the past season, how do you feel 3. If swimmers can post autobiographical profiles, how do you feel 4. If swimmers cannot post autobiographical profiles, how do you feel 5. If you canupload photos, how do you feel .. 6. If you cannotupload photos, how do you feel
Answers with 25 possible combinations FIG. 11.2 You can graph a swimmer's times in an I like it that way event over the past season I expect it to be that way Functional form of Question I am neutral I can live with it that way I dislike it that way You cannot graph a I expect it to be that way swimmer's times in an I like it that way event over the past I am neutral season I can live with it that way I dislike it that way Dysfunctional form of question 11.2 The Functional and Dysfunctional forms of a question How can both answers be used to assess the user s opinion?
FIG. 11.2 You can graph a swimmer's times in an I like it that way event over the past season I expect it to be that way Functional form of Question I am neutral I can live with it that way I dislike it that way Fig. 11.2 You cannot graph a I expect it to be that way swimmer's times in an I like it that way event over the past I am neutral season I can live with it that way I dislike it that way Dysfunctional form of question Dysfunctional Question Categorizing a feature from answers to a pair of questions Live with Dislike Neutral Expect Like Expect Like Neutral Live with Dislike Q R R R R E I I I R E I I I R E I I I R L M M M Q Functional Question Fig. 11.3 M L E R Q I Must have Linear Exciter Reverse Questionable Indifferent
Fig. 11.3 Categorizing a feature from answers to a pair of questions Crossing referencing the answer to a Functional Question with the answer to the Dysfunctional Question the user s response is reduced to a single meaning. Dysfunctional Question Live with Neutral Expect Dislike Like Like Expect Neutral Live with Dislike Q R R R R E I I I R E I I I R E I I I R L M M M Q Functional Question Fig. 11.3 M L E Question type examples: Functional Question If you can upload photos, how do you feel? Dysfunctional Question If you cannot upload photos, how do you feel? R Q I Must have Linear Exciter Reverse Questionable Indifferent
TABLE 11.1 Percent Distribution of Results from Survey of 30 users Theme Graph event times Can upload photos Post autobiographical profile E L M I R 2% 1% 0% Q 1% 1% 1% 44% 31% 15% 18% 8% 39% 23% 54% 37% 13% 4% 8% E L M Exciter Linear Must have I Indifferent Reverse Questionable R Q The 30 Survey responses were categorized using Fig. 11.3 The findings about each of the 3 Features themes: Graph event times is one dimensional / LINEAR Can upload photos is MUST HAVE Post autobiographical profile has two high value scores (different types of users have different expectations (EXCITER and MUST- HAVE) (Cohn suggests splitting population, using some factor that differentiates two populations)
Relative Weighting (Karl Wiegers, 1999) another approach Table 11.2 Using expert judgment to assess each feature being considered for the next release Product Owner and Team collaborate Product Owner is the Lead (1) (2) (3) (4) (5) (6) (7) (3) (4) (6) (5) (1) + (2) Total (3) Total (5) Story Points 32 21 8 61 Story Points Total Value 14 11 8 33 % of Total 52% 34% 13% 100% Estimated Value % 42% 33% 24% 100% Relative Relative Priority 0.81 0.97 1.85 Penalty 6 2 5 13 Benefit 8 9 3 20 Feature Graph event times Can upload photos Post autobiographical profile Total SCALE OF 1 to 9 Estimate benefits if implemented Estimate penalty if not implemented RELATIVE PENALTY A penalty of 6 represents the cost of not including the Feature. To include the Feature Penalty value > 0
Table 11.2 The Relative Weighting Approach to Prioritization Allows for assessment to include how users are affected by both the presence of the feature as well as the absence of the feature. (1) (2) (3) (4) (5) (6) (7) (3) (4) (6) (5) (1) + (2) Total (3) Total (5) Story Points 32 21 8 61 Story Points Total Value 14 11 8 33 % of Total 52% 34% 13% 100% Estimated Value % 42% 33% 24% 100% Relative Relative Priority 0.81 0.97 1.85 Penalty 6 2 5 13 Benefit 8 9 3 20 Feature Graph event times Can upload photos Post autobiographical profile Total SCALE OF 1 to 9 Estimate benefits if implemented Estimate penalty if not implemented RELATIVE PENALTY A penalty of 6 represents the cost of not including the Feature. To include the Feature Penalty value > 0
(1) (2) (3) (4) (5) (6) (7) (3) (4) (6) (5) (1) + (2) Total (3) Total (5) Story Points 32 21 8 61 Story Points Total Value 14 11 8 33 % of Total 52% 34% 13% 100% Estimated Value % 42% 33% 24% 100% Relative Relative Priority 0.81 0.97 1.85 Penalty 6 2 5 13 Benefit 8 9 3 20 Feature Graph event times Can upload photos Post autobiographical profile Total SCALE OF 1 to 9 Estimate benefits if implemented Estimate penalty if not implemented RELATIVE PENALTY A penalty of 6 represents the cost of not including the Feature. To include the Feature Penalty value > 0 (1) + (2) is the Total Value for each Feature (5) represents the Story Point estimates for each Feature (7) The higher the Priority the greater the value for the effort invested Feature: Post autobiographical profile Generates a little more than half the value of Graph event times ( 8 compared to 14) at one-fourth the effort in story points (8 compared to 32) Highest value-to-cost ratio (1.85 compared to .97 and .81))
Summary Ch. 11 Prioritizing Desirability The Kano analysis is a method to identify whether users see features as must-have, linear, or exciters. Threshold: Must have features (those that must be present in the product for it to be successful) Linear feature: one for which the more provided the better holds true. Exciters and delighters: features that provide great satisfaction (adding a price premium to the product) Relative weighting is a method to assess the benefits of implementing a feature, the penalties for not, and the cost representing the value of a feature.
Summary (page119) Four factors to consider when prioritizing features: 1. The amount and significance of learning and knowledge created by developing the features. 2. The amount of risk removed by developing the features. 3. The financial value of having the features. 4. The cost of developing (and perhaps supporting) the new features. In Kano analysis, features are segregated into must-have, linear features, and exciters. This is done by asking potential users two questions about each feature: 1) how they would feel if the feature were present, and 2) how they would feel if it were not present. Relative weighting provides an approach to assessing the benefits of implementing a feature, the penalties of not implementing it, and the cost into a single value representing the priority of the feature.


")

")

")