Deciphering Fiscal Policy and Taxation Strategies for Economic Growth
Explore the realm of fiscal policy, taxation, and governmental fund allocations to understand how economic decisions shape societal structures. Discover the impact of tax revenue on budget appropriations and delve into advancing racial equity through state tax policies.

Download Presentation

Please find below an Image/Link to download the presentation.
The content on the website is provided AS IS for your information and personal use only. It may not be sold, licensed, or shared on other websites without obtaining consent from the author. If you encounter any issues during the download, it is possible that the publisher has removed the file from their server.
You are allowed to download the files provided on this website for personal or commercial use, subject to the condition that they are used lawfully. All files are the property of their respective owners.
The content on the website is provided AS IS for your information and personal use only. It may not be sold, licensed, or shared on other websites without obtaining consent from the author.
E N D
Presentation Transcript
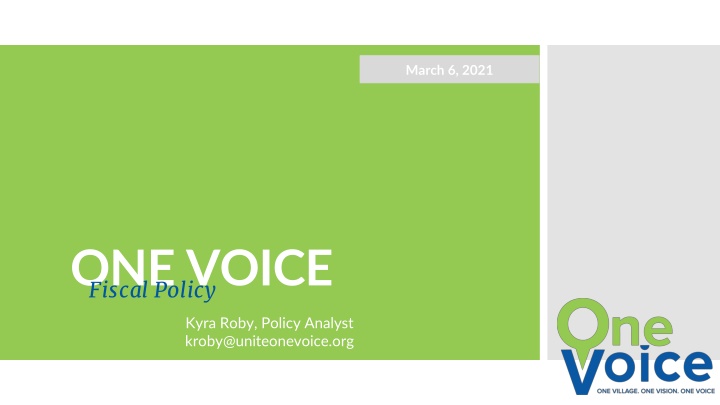
March 6, 2021 ONE VOICE Fiscal Policy Kyra Roby, Policy Analyst kroby@uniteonevoice.org
Fiscal Policy a government's plan for deciding how much money to borrow and to collect in taxes, and how best to spend it, in order to influence the level of economic activity. (Cambridge Business English Dictionary)
We support policies that. . . INCREASE REVENUE Example: tax cuts FUND SERVICES & PROGRAMS Example: school funding, Medicaid expansion, criminal justice REDUCE POVERTY & PROMOTE EQUITY Example: state earned income tax credit, minimum wage , equal pay
TAX REVENUE, GOVERNMENTAL FUNDS FY 2019 45% Federal Government Insurance Premium Tax, 5.40% Tobacco Tax, 2.40% Use Tax, 5.65% Sales Tax, 37.03% Corporate & Franchise Tax, 11.15% 44% State Taxes 11% Other Sources Indivdiual Income Tax, 32.87%
PERCENTAGE OF REGULAR GENERAL FUND APPROPRIATIONS FOR FY 2021 BUDGET Debt Service, 7.83% Legislative, 0.51% Judiciary and Justice, 1.79% Local Assistance, 1.42% Executive and Fiscal Affairs , 2.78% Military, Police and Vets' Affairs, 1.96% Social Welfare, 17.12% All Educational Activities (Excludes IHL Agricultural Units) , 53.30% Corrections, 5.57% Conservation, 0.77% Agriculture and Economic Development, 1.93% Hospital and Hospital Schools, 3.79% All Others, 1.22%
CBPP: Advancing Racial Equity with State Tax Policy-Income Inequality The wealthiest 1% hold about 40% of wealth. White households (65%) own 87% of the nation s wealth. POC (35% of all households) own 13% of the nations wealth. The median net worth of. . . White households is $171,000 Black households is $17,600 Latinx households is $20,700
CBPP: Advancing Racial Equity with State Tax Policy-MS Tax History The oldest supermajority requirement 1890 Three-fifths vote in both houses of the legislature for all state tax increases All understood and desired that some scheme would be evolved which would effectually remove from the sphere of politics in the State the ignorant and unpatriotic negro. The first modern sales tax 1932 A shift in the state tax base away from property owners to consumers
Total State and Local Taxes in Mississippi Share of Family Income 12.0% 10.8% 10.2% 10.1% 10.0% 9.2% 8.1% 8.0% 6.7% 6.5% 6.0% 4.0% 2.0% 0.0% Less than $16,100 $16,100-$25,200 $25,200-$43,600 $43,000-$77,500 $77,500-$162,200 $162,200-$393,800 $393,800 or more Lowest 20% Second 20% Middle 20% Fourth 20% Next 15% Next 4% Top 1% Source: Analysis from Institute on Taxation and Economic Policy, Who Pays? 6th Edition, October 17, 2018.
REDUCING INEQUALITY ITEP: WHO PAYS? 6TH EDITION (2018) Reducing Poverty & Racial Inequities SALES & EXCISE TAXES PAID AS A PERCENTAGE OF INCOME BY INCOME GROUPS PROPERTY TAXES PAID AS A PERCENTAGE OF INCOME BY INCOME GROUPS INCOME TAXES PAID AS A PERCENTAGE OF INCOME BY INCOME GROUPS 3.70% 7.70% 2.50% 7.40% 2.70% 2.60% 2.50% 2.10% 6.20% 1.90% 2.10% 1.80% 1.80% 1.70% 1.70% 5.00% 3.70% 1.00% 2.10% 1.10% 0.30% LOWEST 20% SECOND 20% MIDDLE 20% FOURTH 20% NEXT 15% NEXT 4% TOP 1% LOWEST 20% SECOND 20% MIDDLE 20% FOURTH 20% NEXT 15% NEXT 4% TOP 1% LOWEST 20% SECOND 20% MIDDLE 20% FOURTH 20% NEXT 15% NEXT 4% TOP 1%
HB 1439 Key tax proposals in HB 1439 include: A phased approach to the elimination of Mississippi s income tax. An increase in the state s general sales tax rate to 9.5% from 7%. A reduction in the sales tax paid on groceries to 3.5% from 7%. Sales tax base broadening. An increase in the tax paid on cigarettes by $0.50 a pack.
HB 1439: Income Tax Elimination Income Taxes, General Fund Tax Transfers FY 2009-2019 2019 $1,898,059,305 2018 $1,826,570,133 2017 $1,781,661,110 2016 $1,769,430,613 2015 $1,743,427,423 2014 $1,666,791,328 2013 $1,650,091,463 2012 $1,489,167,466 2011 $1,382,736,224 2010 $1,339,889,032 2009 $1,474,786,559 $2,500,000,000 $2,000,000,000 $1,500,000,000 $1,000,000,000 $500,000,000 $0 2008 2010 2012 2014 2016 2018 2020
PERCENTAGE OF REGULAR GENERAL FUND APPROPRIATIONS FOR FY 2021 BUDGET Debt Service, 7.83% Legislative, 0.51% Judiciary and Justice, 1.79% Local Assistance, 1.42% Executive and Fiscal Affairs , 2.78% Military, Police and Vets' Affairs, 1.96% Social Welfare, 17.12% All Educational Activities (Excludes IHL Agricultural Units) , 53.30% Corrections, 5.57% Conservation, 0.77% Agriculture and Economic Development, 1.93% Hospital and Hospital Schools, 3.79% All Others, 1.22%
HB 1439: Income Tax Elimination Percentage of Individual Income Tax Paid 30.00% 25.16% 25.00% 20.46% 20.00% 15.12% 15.00% 9.21% 10.00% 6.23% 6.20% 6.07% 5.92% 5.62% 5.00% 0.00% Less than $30K $30K to $40K $40K to $50K $50K to $60K $60K to $70K $70 to $100K $100K to $200K $200K to $1M Over $1M Source: Mississippi Department of Revenue, 2019
Impact of Full Income Tax Elimination Lowest 20% Second 20% Middle 20% Fourth 20% Next 15% Next 4% Top 1% Average Income (2019 Incomes) $11,000 $23,000 $39,000 $63,000 $115,000 $248,000 $924,000 Tax Change as % of Income 0.2% 0.9% 1.6% 1.5% 2.2% 2.1% 3.4% Average Tax Change $20 $200 $610 $960 $2,580 $5,160 $31,420 Share of Tax Cut +0% +3% +10% +15% +31% +17% +24% Source: Produced by the Institute on Taxation and Economic Policy and provided to One Voice upon request, 2/24/21.
HB 1439: Income Tax Elimination States without IIT Largest Source of Tax Revenue Other Revenue Source(s) Alaska Property tax (51.8%) Oil Florida Property tax (36.4%) Tourism Nevada Sales tax (41.1%) Tourism (gaming revenue) South Dakota Sales tax (38.7%) Federal Aid Property tax (38%) Texas Property tax (45%) Oil Washington Sales tax (46.4%) Wyoming Property tax (36.7%) Oil, natural gas, coal and other mineral extraction
HB 1439: Income Tax Elimination States without individual income taxes experienced slower economic growth, slower growing average income for residents, little to no improvement on the economic outcomes of residents despite population growth, and higher tax burdens on the poor than states with the highest tax rates. Without exception, the lowest state and local tax rates in the nation for high-income taxpayers are confined to the nine states that do not levy personal income taxes. . . ITEP
HB 1439: Sales Tax Increase SALES & EXCISE TAXES PAID AS A PERCENTAGE OF INCOME BY INCOME GROUPS 7.70% 7.40% 6.20% 5.00% 3.70% 2.10% 1.10% LOW EST 20% SECOND 20% MIDDLE 20% FOURTH 20% NEXT 15% NEXT 4% TOP 1% Source: Analysis from Institute on Taxation and Economic Policy, Who Pays? 6th Edition, October 17, 2018.
Impact of General Sales Tax Rate Increase to 9.5% Top 20 % Bottom 80 % Lowest 20% Second 20% Middle 20% Fourth 20% Next 15% Next 4% Top 1% Average Income (2019 Incomes) $11,000 $23,000 $39,000 $63,000 $115,000 $248,000 $924,000 Tax Change as % of Income +1.9% +2.0% +1.7% +1.4% +1.0% +0.6% +0.3% Source: Produced by the Institute on Taxation and Economic Policy and provided to One Voice upon request, 2/24/21.
Combined Impact of General Sales Tax Rate Increase to 9.5% and Food Tax Cut to 3.5% Top 20 % Bottom 80 % Lowest 20% Second 20% Middle 20% Fourth 20% Next 15% Next 4% Top 1% Average Income (2019 Incomes) $11,000 $23,000 $39,000 $63,000 $115,000 $248,000 $924,000 Tax Change as % of Income +1.6% +1.7% +1.5% +1.2% +0.9% +0.5% +0.3% Source: Produced by the Institute on Taxation and Economic Policy and provided to One Voice upon request, 2/24/21.
Combined Impact of Full Income Tax Elimination, General Sales Tax Rate Increase to 9.5% , Food Tax Cut to 3.5% and Cigarette Tax Increase (.50) Top 40 % Bottom 60 % Lowest 20% Second 20% Middle 20% Fourth 20% Next 15% Next 4% Top 1% Average Income (2019 Incomes) $11,000 $23,000 $39,000 $63,000 $115,000 $248,000 $924,000 Tax Change as % of Income +2.0% +1.1% +0.1% 0.2% 1.3% 1.5% 3.1% Average Tax Change +$220 +$270 +$30 $120 $1,450 $3,760 $28,610 Source: Produced by the Institute on Taxation and Economic Policy and provided to One Voice upon request, 2/24/21.
Fiscal Policy Other Fiscal Policy Matters State Earned Income Tax Credit COVID-19 Relief State Minimum W age Education Funding Medicaid Expansion Criminal Justice Funding Equal Pay Tax Reform
Earned Income Tax Credit EITC Earned Income Tax Credits ( EITC ) are tax credits that benefit low-to-moderate income working families by reducing personal income tax liability. Depending on a family s income, including salaries and wages, whether married or single, and number of qualifying children., the EITC allows for a tax credit equal to a certain percentage of the family s earnings. Example: For Tax Year 2021, a married couple with two children with an adjusted gross income of $53,865 or less can claim $5,980 in federal credits. Lowest 20% of income earners, 2019 56% Second 20% of income earners, 2019 44% Middle 20% of income earners, 2019 31% Fourth 20% of income earners, 2019 12% Next 15% Next 4% Top 1% Average % of families receiving a tax cut Average reduction in tax amount for those with cut - - - Source: Institute Economic Policy and provided to One Voice upon request, 2021. Produced on by the and Taxation -$288 -$344 -$217 -$282 - - -
Enact progressive tax systems that support requiring wealthier individuals to pay their fair share of the state s tax burdens. An Equitable Tax Introduce or expand low-income tax credits, such as the Earned Income Tax Credit. Eliminate fines and fees as a revenue source for courts and reform policies affecting the criminal justice system. System Invest in services and programs that raise revenue. Eliminate subsidies and require corporations to pay their fair share of taxes. Modernize the state s sales tax. Reject legislation resulting in ineffective tax breaks. Restructure rules concerning the state s rainyday funds.
CBPP: Advancing Racial Equity with State Tax Policy-Racial Inequality Law vs. Bias Political Power Disenfranchisement Redistricting* Gerrymandering* Policy In 45 of the 50 states, state and local tax systems worsen racial and ethnic inequalities. Progressive vs. Regressive tax policies State spending
Kyra Roby, Policy Analyst kroby@uniteonevoice.org (601) 960-9594