Decreasing CO2 Emission Trends Analysis
Explore the data on CO2 emission levels from 1990 to 1998 for various countries, analyzing changes and percentages to understand the impact on climate change. Learn how to calculate percentage changes and gain insights into the environmental concerns regarding rising CO2 levels.

Download Presentation

Please find below an Image/Link to download the presentation.
The content on the website is provided AS IS for your information and personal use only. It may not be sold, licensed, or shared on other websites without obtaining consent from the author. If you encounter any issues during the download, it is possible that the publisher has removed the file from their server.
You are allowed to download the files provided on this website for personal or commercial use, subject to the condition that they are used lawfully. All files are the property of their respective owners.
The content on the website is provided AS IS for your information and personal use only. It may not be sold, licensed, or shared on other websites without obtaining consent from the author.
E N D
Presentation Transcript
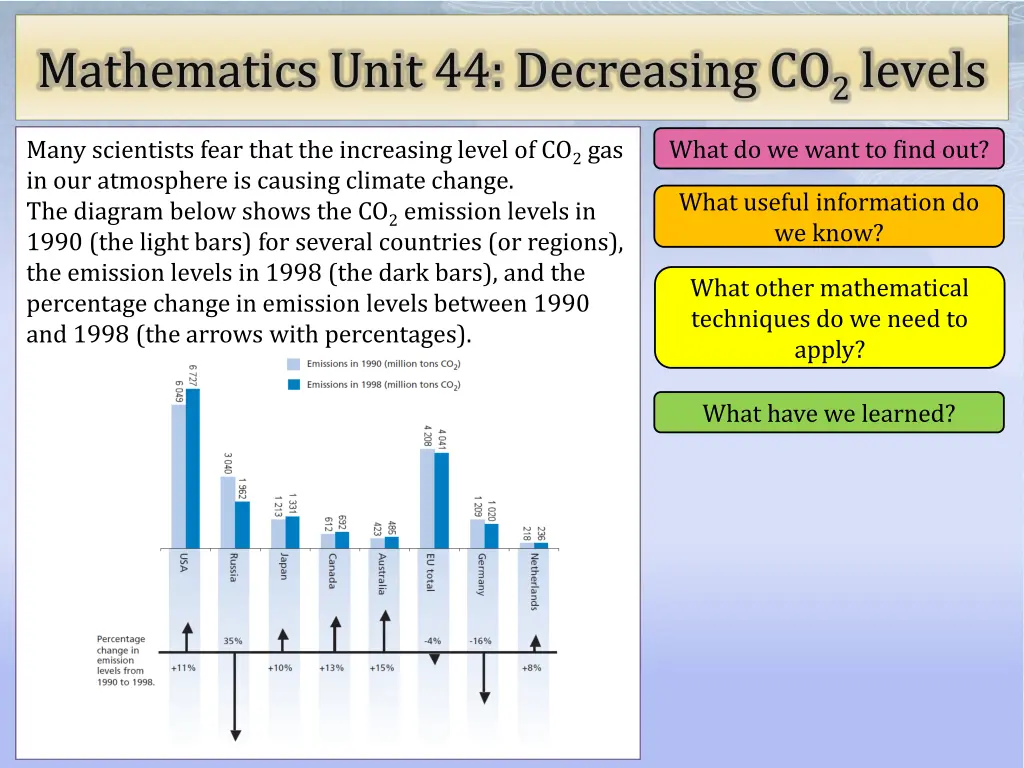
Mathematics Unit 44: Decreasing CO2levels What do we want to find out? What do we want to find out? Many scientists fear that the increasing level of CO2 gas in our atmosphere is causing climate change. The diagram below shows the CO2 emission levels in 1990 (the light bars) for several countries (or regions), the emission levels in 1998 (the dark bars), and the percentage change in emission levels between 1990 and 1998 (the arrows with percentages). What useful information do we know? What useful information do we know? What other mathematical techniques do we need to apply? What other mathematical techniques do we need to apply? What have we learned? What have we learned?
Mathematics Unit 44: Decreasing CO2 levels What do we want to find out? What do we want to find out? What useful information do we know? What useful information do we know? What other mathematical techniques do we need to apply? What other mathematical techniques do we need to apply? What have we learned? What have we learned? QUESTION 44.1 In the diagram you can read that in the USA, the increase in CO2 emission level from 1990 to 1998 was 11%. Show the calculation to demonstrate how the 11% is obtained.
Mathematics Unit 44: Decreasing CO2 levels What do we want to find out? What do we want to find out? What useful information do we know? What useful information do we know? What other mathematical techniques do we need to apply? What other mathematical techniques do we need to apply? What have we learned? What have we learned? QUESTION 44.1 In the diagram you can read that in the USA, the increase in CO2 emission level from 1990 to 1998 was 11%. Show the calculation to demonstrate how the 11% is obtained. Back to start Back to start
Mathematics Unit 44: Decreasing CO2 levels What do we want to find out? What do we want to find out? What useful information do we know? What useful information do we know? What other mathematical techniques do we need to apply? What other mathematical techniques do we need to apply? What have we learned? What have we learned? QUESTION 44.1 In the diagram you can read that in the USA, the increase in CO2 emission level from 1990 to 1998 was 11%. Show the calculation to demonstrate how the 11% is obtained. Back to start Back to start
Mathematics Unit 44: Decreasing CO2 levels What do we want to find out? What do we want to find out? What useful information do we know? What useful information do we know? What other mathematical techniques do we need to apply? What other mathematical techniques do we need to apply? What have we learned? What have we learned? QUESTION 44.1 In the diagram you can read that in the USA, the increase in CO2 emission level from 1990 to 1998 was 11%. Show the calculation to demonstrate how the 11% is obtained. Back to start Back to start
Mathematics Unit 44: Decreasing CO2 levels What do we want to find out? What do we want to find out? What useful information do we know? What useful information do we know? What other mathematical techniques do we need to apply? What other mathematical techniques do we need to apply? What have we learned? What have we learned? QUESTION 44.1 In the diagram you can read that in the USA, the increase in CO2 emission level from 1990 to 1998 was 11%. Show the calculation to demonstrate how the 11% is obtained. Back to start Back to start
Mathematics Unit 44: Decreasing CO2 levels What do we want to find out? What do we want to find out? What useful information do we know? What useful information do we know? What other mathematical techniques do we need to apply? What other mathematical techniques do we need to apply? What have we learned? What have we learned? QUESTION 44.2 Mandy analysed the diagram and claimed she discovered a mistake in the percentage change in emission levels: The percentage decrease in Germany (16%) is bigger than the percentage decrease in the whole European Union (EU total, 4%). This is not possible, since Germany is part of the EU. Do you agree with Mandy when she says this is not possible? Give an explanation to support your answer.
Mathematics Unit 44: Decreasing CO2 levels What do we want to find out? What do we want to find out? What useful information do we know? What useful information do we know? What other mathematical techniques do we need to apply? What other mathematical techniques do we need to apply? What have we learned? What have we learned? QUESTION 44.2 Mandy analysed the diagram and claimed she discovered a mistake in the percentage change in emission levels: The percentage decrease in Germany (16%) is bigger than the percentage decrease in the whole European Union (EU total, 4%). This is not possible, since Germany is part of the EU. Do you agree with Mandy when she says this is not possible? Give an explanation to support your answer. Back to start Back to start
Mathematics Unit 44: Decreasing CO2 levels What do we want to find out? What do we want to find out? What useful information do we know? What useful information do we know? What other mathematical techniques do we need to apply? What other mathematical techniques do we need to apply? What have we learned? What have we learned? QUESTION 44.2 Mandy analysed the diagram and claimed she discovered a mistake in the percentage change in emission levels: The percentage decrease in Germany (16%) is bigger than the percentage decrease in the whole European Union (EU total, 4%). This is not possible, since Germany is part of the EU. Do you agree with Mandy when she says this is not possible? Give an explanation to support your answer. Back to start Back to start
Mathematics Unit 44: Decreasing CO2 levels What do we want to find out? What do we want to find out? What useful information do we know? What useful information do we know? What other mathematical techniques do we need to apply? What other mathematical techniques do we need to apply? What have we learned? What have we learned? QUESTION 44.2 Mandy analysed the diagram and claimed she discovered a mistake in the percentage change in emission levels: The percentage decrease in Germany (16%) is bigger than the percentage decrease in the whole European Union (EU total, 4%). This is not possible, since Germany is part of the EU. Do you agree with Mandy when she says this is not possible? Give an explanation to support your answer. Back to start Back to start
Mathematics Unit 44: Decreasing CO2 levels What do we want to find out? What do we want to find out? What useful information do we know? What useful information do we know? What other mathematical techniques do we need to apply? What other mathematical techniques do we need to apply? What have we learned? What have we learned? QUESTION 44.2 Mandy analysed the diagram and claimed she discovered a mistake in the percentage change in emission levels: The percentage decrease in Germany (16%) is bigger than the percentage decrease in the whole European Union (EU total, 4%). This is not possible, since Germany is part of the EU. Do you agree with Mandy when she says this is not possible? Give an explanation to support your answer. Back to start Back to start
Mathematics Unit 44: Decreasing CO2 levels What do we want to find out? What do we want to find out? What useful information do we know? What useful information do we know? What other mathematical techniques do we need to apply? What other mathematical techniques do we need to apply? What have we learned? What have we learned? QUESTION 44.2 Mandy and Niels discussed which country (or region) had the largest increase of CO2 emissions. Each came up with a different conclusion based on the diagram. Give two possible correct answers to this question, and explain how you can obtain each of these answers.
Mathematics Unit 44: Decreasing CO2 levels What do we want to find out? What do we want to find out? What useful information do we know? What useful information do we know? What other mathematical techniques do we need to apply? What other mathematical techniques do we need to apply? What have we learned? What have we learned? QUESTION 44.2 Mandy and Niels discussed which country (or region) had the largest increase of CO2 emissions. Each came up with a different conclusion based on the diagram. Give two possible correct answers to this question, and explain how you can obtain each of these answers. Back to start Back to start
Mathematics Unit 44: Decreasing CO2 levels What do we want to find out? What do we want to find out? What useful information do we know? What useful information do we know? What other mathematical techniques do we need to apply? What other mathematical techniques do we need to apply? What have we learned? What have we learned? QUESTION 44.2 Mandy and Niels discussed which country (or region) had the largest increase of CO2 emissions. Each came up with a different conclusion based on the diagram. Give two possible correct answers to this question, and explain how you can obtain each of these answers. Back to start Back to start
Mathematics Unit 44: Decreasing CO2 levels What do we want to find out? What do we want to find out? What useful information do we know? What useful information do we know? What other mathematical techniques do we need to apply? What other mathematical techniques do we need to apply? What have we learned? What have we learned? QUESTION 44.2 Mandy and Niels discussed which country (or region) had the largest increase of CO2 emissions. Each came up with a different conclusion based on the diagram. Give two possible correct answers to this question, and explain how you can obtain each of these answers. Back to start Back to start
Mathematics Unit 44: Decreasing CO2 levels What do we want to find out? What do we want to find out? What useful information do we know? What useful information do we know? What other mathematical techniques do we need to apply? What other mathematical techniques do we need to apply? What have we learned? What have we learned? QUESTION 44.2 Mandy and Niels discussed which country (or region) had the largest increase of CO2 emissions. Each came up with a different conclusion based on the diagram. Give two possible correct answers to this question, and explain how you can obtain each of these answers. Back to start Back to start