Defending Rights & Breaking Barriers: Global AIDS Update 2019
In the Global AIDS Update 2019, key statistics and trends regarding HIV testing, treatment, new infections, and country-specific data for Latin America and Eastern Europe are highlighted. The visuals illustrate the progress and challenges in reaching people with HIV services. The report focuses on communities at the center of efforts to combat HIV/AIDS, emphasizing the importance of defending rights and breaking barriers to ensure access to treatment and care.
Download Presentation

Please find below an Image/Link to download the presentation.
The content on the website is provided AS IS for your information and personal use only. It may not be sold, licensed, or shared on other websites without obtaining consent from the author. If you encounter any issues during the download, it is possible that the publisher has removed the file from their server.
You are allowed to download the files provided on this website for personal or commercial use, subject to the condition that they are used lawfully. All files are the property of their respective owners.
The content on the website is provided AS IS for your information and personal use only. It may not be sold, licensed, or shared on other websites without obtaining consent from the author.
E N D
Presentation Transcript
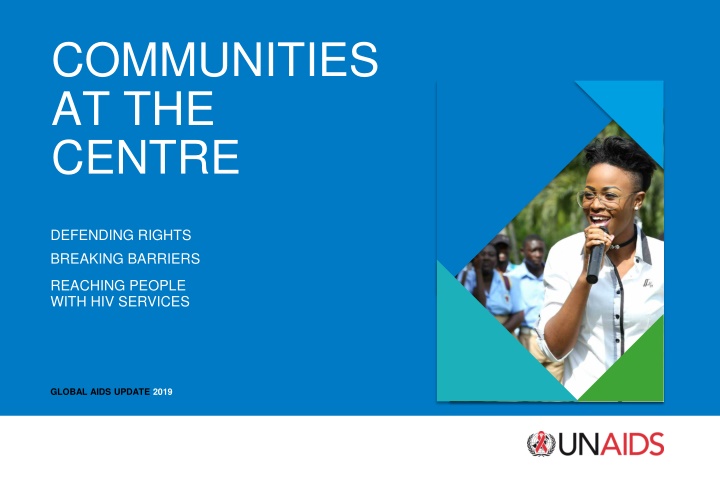
COMMUNITIES AT THE CENTRE DEFENDING RIGHTS BREAKING BARRIERS REACHING PEOPLE WITH HIV SERVICES GLOBAL AIDS UPDATE 2019
GLOBAL AIDS UPDATE 2019 INTRODUCTION AND SUMMARY
HIV testing and treatment cascade, global, 2018 40 Gap to reaching the first 90: 4.3 million 35 Gap to reaching the first and second 90s: 7.4 million 30 Gap to reaching all three 90s: 7.7 million 25 Number of people living with HIV (million) 79% [67 92%] 20 62% [46 74%] 53% [43 63%] 15 10 5 0 People living with HIV who know their status People living with HIV on treatment People living with HIV who are virally suppressed Source: UNAIDS special analysis, 2019; see annex on methods for more details.
Number of new HIV infections and AIDS-related deaths, global, 1990 2018 4 500 000 4 000 000 3 500 000 3 000 000 Number 2 500 000 2 000 000 1 500 000 1 000 000 500 000 0 1990 1995 2000 2005 2010 2015 2018 New HIV infections AIDS-related deaths Source: UNAIDS 2019 estimates.
New HIV infections among children and adults, global, 20002018 Adults (aged 15 years and older) Children (aged 0 14 years) 800 000 350 000 Percentage Percentage change in new HIV infections since 2010 13% change in new HIV child infections since 2010 41% 700 000 300 000 Number of new HIV infections Number of new HIV infections 600 000 250 000 500 000 200 000 400 000 150 000 300 000 100 000 200 000 50 000 100 000 0 0 2000 2010 2018 2000 2010 2018 New HIV infections New HIV infections Source: UNAIDS 2019 estimates. Source: UNAIDS 2019 estimates.
Percentage change in new HIV infections, by country, Latin America, 2010 2018 40 34% 30 22% 21% 21% 20 9% 10 7% 6% Per cent 2% 0 0% -6% -10 -8% -11% -12% -20 -22% -30 -29% -40 -50 -48% -60 Paraguay Uruguay Mexico Chile Colombia Honduras Bolivia (Plurinational State of) Nicaragua Argentina Peru Brazil Panama El Salvador Guatemala Costa Rica Ecuador Source: UNAIDS 2019 estimates.
Number of new HIV infections, eastern Europe and central Asia, with and without the Russian Federation, 2010 2018 180 000 160 000 +29% 140 000 Number of new HIV infections 120 000 100 000 80 000 60 000 -4% 40 000 20 000 0 2010 2011 2012 2013 2014 2015 2016 2017 2018 Eastern Europe and central Asia Eastern Europe and central Asia without the Russian Federation Source: UNAIDS 2019 estimates.
Total HIV resource availability per person living with HIV in constant 2016 US dollars, HIV incidence and AIDS-related mortality rates (per 1000), low- and middle-income countries in eastern and southern Africa, 2010 2018 and 2020 targets 600 3.5 Incidence and mortality rates 3.0 HIV resources per person 500 living with HIV (US$) per 1000 population 2.5 400 2.0 300 1.5 200 1.0 100 0.5 0 0 2010 2011 2012 2013 2014 2015 2016 2017 2018 2020 Resource availability per person living with HIV Resource needs per person living with HIV HIV incidence rate (per 1000) AIDS-related mortality rate (per 1000) Source: UNAIDS 2019 resource availability and needs estimates; and UNAIDS 2019 estimates.
Total HIV resource availability per person living with HIV in constant 2016 US dollars, HIV incidence and AIDS-related mortality rates (per 1000), low- and middle-income countries in western and central Africa, 2010 2018 and 2020 targets 900 0.80 800 0.70 Incidence and mortality rates HIV resources per person 700 0.60 living with HIV (US$) per 1000 population 600 0.50 500 0.40 400 0.30 300 0.20 200 0.10 100 0 0 2010 2011 2012 2013 2014 2015 2016 2017 2018 2020 Resource availability per person living with HIV Resource needs per person living with HIV HIV incidence rate (per 1000) AIDS-related mortality rate (per 1000) Source: UNAIDS 2019 resource availability and needs estimates; and UNAIDS 2019 estimates.
Distribution of new HIV infections (aged 1549 years), by population, global, 2018 Sex workers 6% People who inject drugs 12% Gay men and other men who have sex with men 17% Remaining population 46% Transgender women 1% Clients of sex workers and sex partners of other key populations 18% Source: UNAIDS special analysis, 2019.
Countries reporting safeguards and restrictions for the registration and operation of civil society and community-based organizations that deliver HIV services, global, 2019 100 90 80 Number of countries 70 60 50 40 30 20 10 0 Registration of HIV CSOs is possible Registration of CSOs/ CBOs working with key populations is possible HIV services can be provided by CSOs/CBOs Services to key populations can be provided by CSOs/CBOs Reporting requirements for CSOs/CBOs delivering HIV services are streamlined Restrictions on registration Territorial restrictions to operations, such as zoning Restrictions on providing services to key populations Cumbersome reporting and other restrictions on operations Other restrictions No restrictions National authorities Civil society Note: CSO = civil society organization and CBO = community-based organization Data included in the graph are from 95 countries that reported on these questions from both national authorities (National Commitments and Policy Instrument, Part A) and civil society (National Commitments and Policy Instrument, Part B). Source: 2019 National Commitments and Policy Instrument.
Countries reporting safeguards and restrictions for the registration and operation of civil society and community-based organizations that deliver HIV services, global, 2019 50 45 40 Number of countries 35 30 25 20 15 10 5 0 Social From Both from domestic funding and international donors Require a certain percentage of government funding for civil society and community- based organizations Other There are no laws, policies or regulations enabling access to funding for civil society and community- based organizations Lack of social contracting or other mechanisms allowing for funding of community-led service delivery to be funded from domestic funding Other Foreign agents or other restrictions to accessing funding from international donors contracting or other mechanisms allowing for funding of service delivery by communities from domestic funding international donors Laws, policies or regulations that enable access to funding (reported by national authorities) Laws, policies or regulations that hinder access to funding (reported by civil society) Note: Data included in the graph are from 107 countries that reported on at least one of these questions. Source: 2019 National Commitments and Policy Instrument.
Progress towards 909090 testing and treatment targets, Eshowe and Mbongolwane, South Africa, 2013 and 2018 100 95 94 93 90 90 76 80 70 70 60 Per cent 50 40 30 20 10 0 Awareness of HIV status (First 90) Treatment coverage (Second 90) Suppressed viral load (Third 90) 2013 2018 Source: Province of KwaZulu-Natal Department of Health, M decins Sans Fronti res. Mbongolwane and Eshowe: KwaZulu-Natal HIV Impact Surveys, 2013 2018.
Enrolment in differentiated models of care, urban and rural areas, Eshowe and Mbongolwane, South Africa, 2012 2019 14 000 90 80 12 000 Number of active HIV treatment patients eligible for differentiated models of care 70 10 000 60 8000 50 Per cent 40 6000 30 4000 20 2000 10 0 0 Q1 Q2 Q3 Q4 Q1 Q2 Q3 Q4 Q1 Q2 Q3 Q4 Q1 Q2 Q3 Q4 Q1 Q2 Q3 Q4 Q1 Q2 Q3 Q4 Q1 Q2 Q3 Q4 Q1 2012 2013 2014 2015 2016 2017 2018 2019 Patients in differentiated models of care Patients not in differentiated models of care Percentage in differentiated models of care among those eligible Source: Differentiated models of care: Mbongolwane and Eshowe, uMlalazi Municipality, King Cetshwayo District, KwaZulu Natal, South Africa. Cape Town: M decins Sans Fronti res; 2019.

