Delaware Health Resources Board Data Analysis
This data analysis covers Delaware nursing home utilization reports, bed projections, population growth, and demographic trends. It provides insights into population projections and age-specific growth in different regions of Delaware from 2010 to 2040.

Download Presentation

Please find below an Image/Link to download the presentation.
The content on the website is provided AS IS for your information and personal use only. It may not be sold, licensed, or shared on other websites without obtaining consent from the author.If you encounter any issues during the download, it is possible that the publisher has removed the file from their server.
You are allowed to download the files provided on this website for personal or commercial use, subject to the condition that they are used lawfully. All files are the property of their respective owners.
The content on the website is provided AS IS for your information and personal use only. It may not be sold, licensed, or shared on other websites without obtaining consent from the author.
E N D
Presentation Transcript
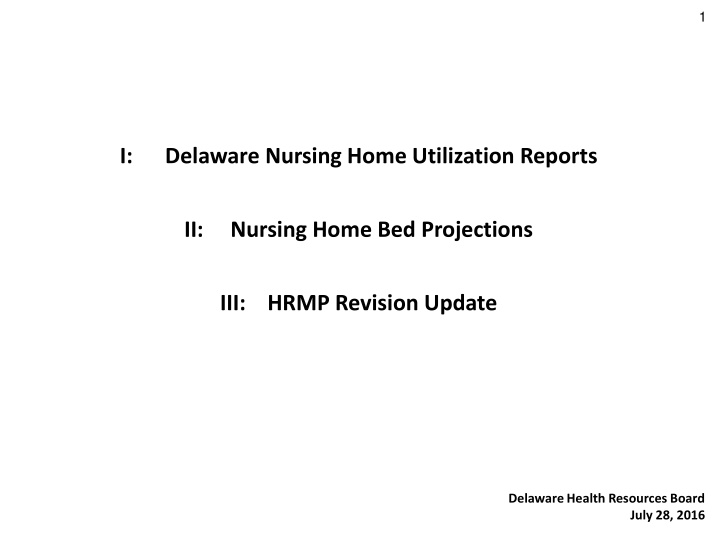
1 I: Delaware Nursing Home Utilization Reports II: Nursing Home Bed Projections III: HRMP Revision Update Delaware Health Resources Board July 28, 2016
2 Part I: Delaware Nursing Home Utilization Reports Two Reports for Review and Approval 1. Data Year 2014 2. Data Year 2015 2016 data currently being submitted by Delaware nursing homes Anticipated completion data for 2016 Report = Spring 2017
3 OVERALL Population Growth in Delaware 2010-2040 Percentage Increase 2010 2015 2020 2025 2030 2035 2040 Delaware 19.4% 12.7% 28.1% 30.8% 899,716 943,879 982,358 1,015,437 1,040,518 1,059,990 1,074,556 New Castle Kent 538,870 555,779 571,785 586,089 596,006 603,017 607,080 162,949 174,025 182,851 190,283 197,236 203,374 208,694 Sussex 197,897 214,075 227,722 239,065 247,276 253,599 258,782 Source: Annual Population Projections, Delaware Population Consortium, Version 2014.0, October 2014
4 65+ Population Growth in Delaware 2010-2040 Percentage Increase 2010 2015 2020 2025 2030 2035 2040 37.9% 85.5% 120.6% 143.8% 203.2% 65-69 70-74 42,159 50,470 55,351 62,498 64,372 61,697 58,154 30,883 37,658 46,957 51,371 57,914 59,739 57,303 75-79 23,930 26,811 33,300 41,551 45,308 51,115 52,796 80-84 17,269 18,822 22,059 27,472 34,253 37,296 42,097 85+ 15,893 19,355 23,240 27,412 33,429 41,639 48,190
5 65+ Population Growth in Delaware DELAWARE 2010 2015 2020 2025 2030 2035 2040 2010-40 % Increase 65-69 70-74 75-79 80-84 85+ 37.9% 42,159 50,470 55,351 62,498 64,372 61,697 58,154 85.5% 30,883 37,658 46,957 51,371 57,914 59,739 57,303 120.6% 23,930 26,811 33,300 41,551 45,308 51,115 52,796 143.8% 17,269 18,822 22,059 27,472 34,253 37,296 42,097 203.2% 15,893 2010 19,355 2015 23,240 2020 27,412 2025 33,429 2030 41,639 2035 48,190 2040 NEW CASTLE 2010-40 % Increase 65-69 70-74 75-79 80-84 85+ 50.1% 20,780 26,803 30,791 35,109 35,882 33,814 31,181 107.7% 14,945 18,391 24,307 28,000 31,964 32,820 31,039 137.1% 12,108 13,079 15,918 21,110 24,332 27,867 28,712 140.1% 9,452 9,525 10,528 12,880 17,114 19,780 22,690 163.1% 9,270 10,939 2015 12,045 2020 13,244 2025 15,598 2030 20,028 2035 24,393 2040 KENT 2010 2010-40 % Increase 65-69 70-74 75-79 80-84 85+ 61.9% 7,320 6,708 7,658 9,126 9,905 11,284 11,851 87.4% 5,510 5,593 6,163 7,002 8,356 9,062 10,326 86.0% 4,235 4,220 4,849 5,350 6,088 7,262 7,877 117.9% 2,681 2,938 3,382 3,864 4,296 4,892 5,843 143.1% 2,432 2,497 3,239 3,891 4,518 5,147 5,912 SUSSEX 2010 2015 2020 2025 2030 2035 2040 2010-40 % Increase 65-69 70-74 75-79 80-84 85+ 7.6% 14,059 16,959 16,902 18,263 18,585 16,599 15,122 52.8% 10,428 13,674 16,487 16,369 17,594 17,857 15,938 113.6% 7,587 9,512 12,533 15,091 14,888 15,986 16,207 164.1% 5,136 6,359 8,149 10,728 12,843 12,624 13,564 326.7% 4,191 5,919 7,956 10,277 13,313 16,464 17,885 Source: Annual Population Projections, Delaware Population Consortium, Version 2014.0, October 2014
6 Delaware Nursing Homes (as of 2015) 47 total facilities 44 private 3 public Sussex County: New Castle County: 11 private facilities 27 private facilities 2 public facilities (EPBH, GBHC) Kent County: 6 private facilities 1 public facility (DHCI)
7 Delaware Nursing Home Licensed Bed Counts Private Facilities Public Facilities All Facilities Total Private Year New Castle Kent Sussex Homes Beds Homes Beds Homes Beds Homes Beds Homes Beds Homes Beds 2005 2006 2007 2008 2009 2010 2011 2012 2013 2014 2015 2005-2015 27 26 27 26 26 26 26 27 27 27 27 2,516 2,427 2,523 2,498 2,519 2,519 2,519 2,569 2,649 2,649 2,646 5 5 6 6 6 6 6 6 6 6 6 521 530 642 642 642 642 642 672 672 672 672 10 10 10 12 11 11 11 11 11 11 11 1,133 1,144 1,143 1,323 1,234 1,234 1,234 1,264 1,264 1,264 1,264 42 41 43 44 43 43 43 44 44 44 44 4,170 4,101 4,308 4,463 4,395 4,395 4,395 4,505 4,585 4,585 4,582 4 4 4 4 4 3 3 3 3 3 3 652 655 626 626 626 591 591 576 522 375 312 46 45 47 48 47 46 46 47 47 47 47 4,822 4,756 4,934 5,089 5,021 4,986 4,986 5,081 5,107 4,960 4,894 5.2% 29.0% 11.6% 9.9% -52.1% 1.5% % Change
8 Measure of Utilization: BILLABLE PATIENT DAYS Billable Patient Day: a unit of time (i.e., one day) during which the facility s services are used by one patient. For example, if a nursing home has 100 patients on a particular day, the facility has generated 100 billable patient days for that particular 24-hour period. Billable patient days tell us about broad utilization, but don t provide insight into more detailed patterns of use Scenario A: Scenario B: 50 patients stay 20 days each 1,000 billable days / month 500 patients stay 2 days each 1,000 billable days / month
9 Measure of Utilization: BILLABLE PATIENT DAYS If a facility s number of billable patient days increases from one time period to the next, it is an indication that the facility is a. Caring for more patients b. Caring for patients for longer periods of time, or c. A combination of these two factors.
10 Delaware Nursing Home Billable Patient Days Private Facilities Public Facilities Total New Castle Kent Sussex All Facilities Year Private 2005 800,955 176,226 367,391 1,344,572 135,622 1,480,194 2006 809,733 175,027 373,221 1,357,981 144,357 1,502,338 2007 830,921 179,315 371,520 1,381,756 142,893 1,524,649 2008 833,344 208,235 387,715 1,429,294 143,640 1,572,934 2009 824,262 219,019 404,234 1,447,515 137,584 1,585,099 2010 838,037 218,593 402,188 1,458,818 137,824 1,596,642 2011 829,974 219,302 398,550 1,447,826 131,675 1,579,501 2012 843,039 219,558 403,842 1,466,439 114,177 1,580,616 2013 860,924 218,651 404,942 1,484,517 98,108 1,582,625 2014 871,456 224,370 419,167 1,514,993 87,792 1,602,785 2015 867,015 226,841 412,646 1,506,502 76,993 1,583,495 2005-2015 8.2% 28.7% 12.3% 12.0% -43.2% 7.0% % Change Historical trends in billable patient day data mirrors increases / decreases in licensed bed counts.
11 Occupancy Rates The proportion of nursing home beds in use during the course of a 12-month period Calculation Steps: 1. Obtain total number actually-used billable patient days (for the year) for each facility 2. Multiply each facility s average annual bed count by 365 to obtain the total number possible billable patient days for each facility 3. Divide: Occupancy Rate = (number actually-used BPD) / (number possible BPD) In Delaware, occupancy rates for private facilities ranged from 71.8% - 97.7% Median: 90.3%
12 Delaware Nursing Home Occupancy Rates Private Facilities Public Facilities All Total Private Facilities Year New Castle Kent Sussex 2005 87.2% 92.7% 88.8% 88.3% 57.0% 84.1% 2006 91.4% 90.5% 89.4% 90.7% 60.4% 86.5% 2007 90.2% 76.5% 89.1% 87.9% 62.5% 84.7% 2008 91.4% 88.9% 80.3% 87.7% 62.9% 84.7% 2009 89.6% 93.5% 89.7% 90.2% 60.2% 86.5% 2010 91.1% 93.3% 89.3% 90.9% 63.9% 87.7% 2011 90.3% 93.6% 88.5% 90.3% 61.0% 86.8% 2012 91.1% 89.5% 87.5% 89.8% 54.3% 85.8% 2013 89.0% 89.1% 87.8% 88.7% 51.5% 84.9% 2014 90.1% 91.5% 90.9% 90.5% 64.1% 88.5% 2015 89.8% 92.5% 89.4% 90.1% 67.7% 88.7% 2005-2015 % Change 2.6% -0.2% -0.4% 1.8% 10.7% 4.6% 2013 U.S. Avg. NH Occupancy Rate: 82.2% (http://www.cdc.gov/nchs/data/hus/hus13.pdf#110; Table 110)
13 Delaware Nursing Home Admissions Private Facilities Public Facilities Total Private All Facilities New Castle Kent Sussex Year 5,442 618 2,001 8,061 68 8,129 2005 5,652 870 2,250 8,772 145 8,917 2006 5,358 755 2,246 8,359 156 8,515 2007 5,709 954 2,279 8,942 113 9,055 2008 5,835 1,066 3,242 10,143 126 10,269 2009 5,928 1,164 3,088 10,180 90 10,270 2010 6,406 1,353 3,247 11,006 119 11,125 2011 6,654 1,493 3,563 11,710 65 11,775 2012 6,566 1,696 3,477 11,739 31 11,770 2013 6,816 1,726 3,983 12,525 50 12,575 2014 6,544 1,612 3,672 11,828 64 11,892 2015 2005-2015 % Change 15.8% 85.3% 63.2% 34.8% -55.9% 33.4%
14 Delaware Nursing Home Admissions, by Race and Age, 2015 Age Groups Total Under 65 65-74 75-84 85+ Admissions (by Race) 80.5% 17.9% 1.7% White (N=9,572) Black (N=2,123) Other (N=197) 12.0% 26.3% 14.2% 19.8% 25.9% 28.9% 32.8% 28.4% 37.6% 35.5% 19.4% 19.3% Total (by Age) (N=11,892) 14.6% 21.0% 32.1% 32.2% 100.0% White patients represented 80% of all DE NH admissions 2015 Age is positively correlated with proportion of admissions Discharge trends mirror admission trends
15 Delaware Nursing Home Admissions, by Race and Age, 2015
16 Delaware Nursing Home Admissions, by Destination, 2015 Discharge Destination State Owned LTCF 0.6% Assisted Living Private LTCF Facility Type Home Hospital Death Other Private (N=11,429) 59.9% 21.7% 3.2% 2.5% 10.8% 1.3% Public (N=97) 4.1% 5.2% 0.0% 17.5% 40.2% 32.0% 1.0% All facilities (N=11,526) 59.9% 21.5% 3.2% 2.6% 0.9% 11.0% 1.3%
17 How Has the Private Nursing Home Care Changed In Delaware? 2005 2015 Percentage Difference in Utilization Measures New Castle (private) Kent (private) Sussex (private) Total Private Bed Count 5.2% 29.0% 11.6% 9.9% Billable Pt Days 8.2% 28.7% 12.3% 12.0% Admissions 15.8% 85.3% 63.2% 34.8% Discharges 12.6% 100.0% 60.4% 33.2% Occupancy 2.6% -0.2% -0.4% 1.8% Admissions/discharges increased at a higher rate than would be expected by bed expansion alone Private NH facilities caring for more patients for shorter periods of time Consistent with national trends: NH shift toward a higher percentage of shorter-stay rehab care
18 Nursing Home Rates, 2012 U.S. Rate: Range: Delaware Rate: 26.05 per 1,000 persons age 65+ 7.01 per 1,000 (AK) 49.22 per 1,000 (ND) 22.97 per 1,000 (not significantly different from US)
19 Part II: Delaware Nursing Home Bed Projections Two Sets of NH Bed Projections for Review and Approval 1. 2015 2020 (based on report from Data Year 2014) 2. 2016 2021 (based on report from Data Year 2015)
20 Part II: Delaware Nursing Home Bed Projections Revised NH Bed Projection Methodology: A Brief Recap The old projection methods created skewed bed projections, especially for Kent County Previously, all 150 DVH beds considered private Kent County beds Projected bed need artificially low for Kent County Revised methodology developed via HRB Sub-Committee (March 2014) Additional feedback from HRB Members at March 2016 Retreat Test-Driven twice (2015-2020 and 2016-2021 projections)
21 Part II: Delaware Nursing Home Bed Projections Obtain annual billable patient day data (by state and county) 1. For public facilities, allocate proportion of billable patient days to each county according to admission patterns a. Example: if 37% of admissions to DHCI are from NCC, 37% of the billable patient days generated by DHCI are appropriated to NCC) i. Proportion of Billable Patient Days Attributable to Each County: 2014 and 2015 ii. 2014 Data 2015 Data (2016-2021 Projections) (2015-2020 Projections) New Castle 39.8% 44.1% Kent 25.7% 21.3% Sussex 32.7% 34.6% DVH considered a public facility for projection purposes only b.
22 Part II: Delaware Nursing Home Bed Projections Calculate projected population growth factors by age group (by state and county) 2. Most-recently available Delaware Population Consortium Data a. Population growth factors calculated for the most immediate 5-year projection period (i.e., 2015-2020 or 2016-2021) b. Calculate the proportion of NH admissions by age group (<65, 65-74, 75-84, and 85+) and use these proportions to calculate a weighted sum of population growth factors 3.
23 Part II: Delaware Nursing Home Bed Projections Multiply weighted population growth factor by current year billable patient days to obtain projected billable patient days for the last year of the projection period (i.e., for 2020 or 2021) 4. Divide projected billable patient days by 365 to obtain projected bed need 5. Calculate the difference in current and projected bed need to obtain the projected shortage / surplus of NH beds (by state and county) 6.
24 2015 2020 Delaware Nursing Home Bed Projections Delaware Delaware Current Beds Projected Bed Need Shortage / Surplus 4,960 5,043 4,960 5,203 4,960 5,369 4,960 5,548 4,960 5,709 Current Beds Projected Bed Need Shortage / Surplus 4,894 4,967 4,894 5,124 4,894 5,293 4,894 5,445 4,894 5,619 2015-2016 2015-2017 2015-2018 2015-2019 2015-2020 -83 -243 -409 -588 -749 2016-2017 2016-2018 2016-2019 2016-2020 2016-2021 -73 -230 -399 -551 -725 Kent Kent Current Beds Projected Bed Need Shortage / Surplus 657 654 657 675 657 699 657 720 657 743 Current Beds Projected Bed Need Shortage / Surplus 620 643 620 666 620 685 620 707 620 730 2015-2016 2015-2017 2015-2018 2015-2019 2015-2020 3 2016-2017 2016-2018 2016-2019 2016-2020 2016-2021 -23 -46 -65 -87 -110 -18 -42 -63 -86 New Castle New Castle Current Beds Projected Bed Need Shortage / Surplus 2,858 2,862 2,858 2,935 2,858 3,010 2,858 3,096 2,858 3,170 Current Beds Projected Bed Need Shortage / Surplus 2,850 2,876 2,850 2,947 2,850 3,030 2,850 3,100 2,850 3,180 2015-2016 2015-2017 2015-2018 2015-2019 2015-2020 -4 -77 -152 -238 -312 2016-2017 2016-2018 2016-2019 2016-2020 2016-2021 -26 -97 -180 -250 -330 Sussex Sussex Current Beds Projected Bed Need Shortage / Surplus 1,436 1,474 1,436 1,537 1,436 1,602 1,436 1,672 1,436 1,735 Current Beds Projected Bed Need Shortage / Surplus 1,424 1,445 1,424 1,506 1,424 1,571 1,424 1,629 1,424 1,700 2015-2016 2015-2017 2015-2018 2015-2019 2015-2020 -38 -101 -166 -236 -299 2016-2017 2016-2018 2016-2019 2016-2020 2016-2021 -21 -82 -147 -205 -276
25 2016 2021 Delaware Nursing Home Bed Projections Delaware Delaware Current Beds Projected Bed Need Shortage / Surplus 4,960 5,043 4,960 5,203 4,960 5,369 4,960 5,548 4,960 5,709 Current Beds Projected Bed Need Shortage / Surplus 4,894 4,967 4,894 5,124 4,894 5,293 4,894 5,445 4,894 5,619 2015-2016 2015-2017 2015-2018 2015-2019 2015-2020 -83 -243 -409 -588 -749 2016-2017 2016-2018 2016-2019 2016-2020 2016-2021 -73 -230 -399 -551 -725 Kent Kent Current Beds Projected Bed Need Shortage / Surplus 657 654 657 675 657 699 657 720 657 743 Current Beds Projected Bed Need Shortage / Surplus 620 643 620 666 620 685 620 707 620 730 2015-2016 2015-2017 2015-2018 2015-2019 2015-2020 3 2016-2017 2016-2018 2016-2019 2016-2020 2016-2021 -23 -46 -65 -87 -110 -18 -42 -63 -86 New Castle New Castle Current Beds Projected Bed Need Shortage / Surplus 2,858 2,862 2,858 2,935 2,858 3,010 2,858 3,096 2,858 3,170 Current Beds Projected Bed Need Shortage / Surplus 2,850 2,876 2,850 2,947 2,850 3,030 2,850 3,100 2,850 3,180 2015-2016 2015-2017 2015-2018 2015-2019 2015-2020 -4 -77 -152 -238 -312 2016-2017 2016-2018 2016-2019 2016-2020 2016-2021 -26 -97 -180 -250 -330 Sussex Sussex Current Beds Projected Bed Need Shortage / Surplus 1,436 1,474 1,436 1,537 1,436 1,602 1,436 1,672 1,436 1,735 Current Beds Projected Bed Need Shortage / Surplus 1,424 1,445 1,424 1,506 1,424 1,571 1,424 1,629 1,424 1,700 2015-2016 2015-2017 2015-2018 2015-2019 2015-2020 -38 -101 -166 -236 -299 2016-2017 2016-2018 2016-2019 2016-2020 2016-2021 -21 -82 -147 -205 -276
26 Delaware Nursing Home Bed Projections 2015 - 2020 2016 - 2021 Delaware Delaware Current Beds Projected Bed Need Shortage / Surplus 4,960 5,709 Current Beds Projected Bed Need Shortage / Surplus 4,894 5,619 2015-2020 -749 2016-2021 -725 Kent Kent Current Beds Projected Bed Need Shortage / Surplus 657 743 Current Beds Projected Bed Need Shortage / Surplus 620 730 2015-2020 -86 2016-2021 -110 New Castle New Castle Current Beds Projected Bed Need Shortage / Surplus 2,858 3,170 Current Beds Projected Bed Need Shortage / Surplus 2,850 3,180 2015-2020 -312 2016-2021 -330 Sussex Sussex Current Beds Projected Bed Need Shortage / Surplus 1,436 1,735 Current Beds Projected Bed Need Shortage / Surplus 1,424 1,700 2015-2020 -299 2016-2021 -276 Bed need projections does not reflect beds approved but not operational.
27 NH Bed Projections: Summary Points Both sets of projections (2015-2020 and 2016-2021) predict shortages in NH beds that increase over time Predicted bed shortages, by absolute numbers, are greatest in New Castle and Sussex Counties When considered in the context of beds missing per 1,000 persons age 65+, in 2021: New Castle County: 0.57 beds short per 1,000 persons age 65+ Kent County: 0.60 beds short per 1,000 persons age 65+ Sussex County: 1.20 beds short per 1,000 persons age 65+
28 Part III: HRMP Revision Update Previous Presentations / Feedback from Committee Members December 2015 a. January 2016 b. March 2016 (HRMP Retreat) c. Current Version: 8
29 Part III: HRMP Revision Update Version 8: Major Highlights a. Greatly expanded Charity Care section b. Revised NH Bed Projection methods section per sub-committee recs Removed Comprehensive Rehab and Behavioral Health sections (phase II edit) c. Removed the Enforcement section (phase II edit) d. e. Incorporated all written comments from HRB members f. Expanded the Major Medical Equipment section to incorporate additional information from HRB website that was not previously included in the HRMP g. Expanded the New Medical Technology section to incorporate additional relevant details for the applicant to address h. Included page-limit guidelines in the Document Property section
30 Part III: HRMP Revision Update The Path Forward: July 28, 2016: Regulatory Flexibility Analysis/Impact Statement forms will be sent to the Registrar of Regulations office for review/publishing on the September 1st(deadline for submission is 15th of prior month). Attachments to include: Old HRMP (strike through) and HRMP v8; and Public notice. September 1, 2016- Registrar of Regulations office will publish the HRMP and public notice. There will be a 30 day comment on Registrar of Regulations website. This will also be posted to the HRB website. Process to coincide with the HRB Title 16 requirements. September 19, 2016- Public hearing will be held at 1:00 PM at the Delaware Technical Community College Terry Campus Corporate Training Center, Rooms, 400A and B 100 Campus Drive, Dover, DE. (Transcripts will be made available) Written Comments- Accepted through October 3, 2016.
31 END