Delaware School Climate Data Workshop Overview
The Delaware School Climate Data Workshop for the Positive Behavior Support Project held on May 14, 2018, focused on the review of school climate importance, tools used for measurement, and the Delaware School Surveys. It also touched on survey reliability and validity, with evidence from peer-reviewed studies. The participation in the survey and scales used were detailed, along with validity screening items for the student survey.

Download Presentation

Please find below an Image/Link to download the presentation.
The content on the website is provided AS IS for your information and personal use only. It may not be sold, licensed, or shared on other websites without obtaining consent from the author.If you encounter any issues during the download, it is possible that the publisher has removed the file from their server.
You are allowed to download the files provided on this website for personal or commercial use, subject to the condition that they are used lawfully. All files are the property of their respective owners.
The content on the website is provided AS IS for your information and personal use only. It may not be sold, licensed, or shared on other websites without obtaining consent from the author.
E N D
Presentation Transcript
School Climate Data Workshop Delaware Positive Behavior Support Project May 14, 2018
Delaware School Survey Foundation Resource School Climate and the Delaware School Surveys: Review of importance of school climate and overview of tools used to measure it plus more Answers the following questions: Why is school climate importance? How are we doing in Delaware? What do I need to know about the DE School Surveys? review the 5 scales included in the survey list the subscales included in each of the 5 scales per population provide item examples from each scale and subscale Are the DE School Surveys reliable and valid? review evidence of survey reliability review evidence of survey validity provide references to peer-reviewed journal studies
Participation Continues To Be High Number of Participating Schools School Years
2017-18 Survey Sample Student Survey Teacher Survey Home Survey Schools Respondents Schools Respondents Schools Respondents Schools Respondents Schools Respondents Schools Respondents Schools 79 81 3077 26 1200 18 1104 4 66 9 547 5 206 7 362 6,592 72 9186 24 2731 15 834 1 11 5 223 6 688 5 953 14,626 Elementary 15194 26 11582 18 7606 3 75 2 58 N/A N/A 7 4243 38,758 Middle High Alternative Special Early Childhood Other School Climate Workshop, 5/23/12 Respondents
Delaware School Survey Scales (Note: School Climate is 1 of the 5 Scales) Teacher/Staff Scales Student Scales Home Scales School Climate Techniques (School Discipline) Bullying Victimization Student Engagement Student Social and Emotional Competencies School Climate Techniques (School Discipline) School Climate Bullying Victimization Student Engagement
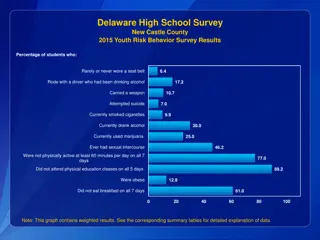
Validity Screening Items on Student Survey Items: SC-31. I am lying on this survey. E-13. I am telling the truth in this survey. Results: 13.7% (5,232) noted lying on item SC-31 and/or E-13 and thus were deleted 8.3% (3,826) did not respond to either or both items SC-31 and E-13 and were deleted
2018 State-wide Results Caution in Comparisons: Schools (and Students) Differ
Percent who Agreed or Agreed a lot Elem School School 96% 89% For example: I like this school. Middle High School 93% Teachers/Staff Home 96% 89% 82% Students 97% 70% 64%
School Climate Scale 2018 Student Survey Results
Total School Climate by Student Grade Student perceptions tend to decrease, especially from elementary to middle school
Grade Level Differences: Student Survey 2018 Scores tend to decrease as students get older, especially from ES to MS Bullying SW is seen as a problem, especially in MS and HS Student-student relations and student engagement SW tend to be low compared to other scores across all levels Teacher-student relations and clarity of expectations tend to be high compared to other scores across all levels Student Engagement School-wide Teacher-Student Relations Fairness of Rules Bullying School-wide Student Relations Clarity of Expectations Total School Climate School Safety
Percent who Agreed or Agreed a lot Sample subscale responses associated with student scores (School Climate) Elem School Middle School High School Teacher-Student Relations 7. Teachers care about their students. 95.8 86.5 78.9 Student Student Relations 11. Students are friendly with each other. 75.8 61.2 64.7 Student Engagement School-wide 28. Most students work hard to get good grades. 92.0 75.8 68.9 Clarity of Expectations 10. Students know how they are expected to act. 88.1 82.3 83.8 Bullying School-wide* 9. Students threaten and bully others. 35.3 53.9 44.3 Fairness of Rules 18. The school s Code of Conduct is fair. 90.1 76.6 69.6 School Safety 13. Students feel safe. 90.3 80.1 75.1 * = A high score on this subscale is negative because items are negatively worded.
Race Differences: Student Survey 2018 Student Engagement School-wide Teacher-Student Relations Fairness of Rules Bullying School-wide Clarity of Expectations Total School Climate Student Relations School Safety
School Climate Scale 2018 Teacher/Staff Survey Results
2018 Teacher Survey Results, K-12 Teachers/staff across grade levels tend to perceive student engagement SW and student relations least favorably and teacher-student relations most favorably. Generally, perceptions decrease from elementary to middle school Student Engagement School-wide Teacher-Student Relations Clarity of Expectations Fairness of Rules Student Relations
2018 Teacher Survey Results, K-12 Teacher-home communications tend to be viewed favorably across grade levels Bullying SW tends to be viewed least favorably by middle school teachers/staff School Safety Total School Climate Teacher-Home Communication Bullying School-wide Staff Relations
Percent who Agreed or Agreed a lot Sample subscale responses associated with teacher/staff scores (School Climate) Elem School Middle School High School Teacher-Student Relations 7. Teachers care about their students. Student Student Relations 11. Students are friendly with each other. Student Engagement School-wide 28. Most students work hard to get good grades. Clarity of Expectations 10. Students know how they are expected to act. Bullying School-wide* 9. Students threaten and bully others. School Safety 13. Students feel safe. 99.1 97.2 98.1 92.3 81.3 88.6 87.0 67.4 63.5 95.5 88.0 87.6 31.0 56.4 42.9 95.4 84.3 90.9 * = A high score on this subscale is negative because items are negatively worded.
Percent who Agreed or Agreed a lot Elem School School Sample subscale responses associated with teacher/staff scores (School Climate) Middle High School Fairness of Rules 18. The school s Code of Conduct is fair. 93.7 88.0 92.3 Teacher-Home Communications 33. Teachers do a good job communicating with parents. Staff Relations 32. Teachers, staff, and administrators function as a good team. 97.0 92.2 87.2 83.4 75.0 75.5
School Climate Scale 2018 Home Survey Results
Grade Level Differences: Home Survey 2017-18 Clarity of expectations tends to be viewed most favorably across grade levels, while student relations is viewed least favorably. Generally, perceptions decrease from elementary to high school, but positive perceptions overall. School Safety Clarity of Expectations Total School Climate Teacher-Student Relations Student Relations Teacher-Home Communication Fairness of Rules
Percent who Agreed or Agreed a lot Elem School School Sample subscale responses associated with home scores (School Climate) Middle High School Teacher-Student Relations 7. Teachers care about their students. Student Student Relations 11. Students are friendly with each other. Clarity of Expectations 10. Students know how they are expected to act. Teacher-Home Communication 24. Teachers work closely with parents to help students when they have problems. 97.4 93.2 87.3 91.0 79.6 76.0 98.3 95.6 91.5 94.5 86.7 78.3
Percent who Agreed or Agreed a lot Elem School School Sample subscale responses associated with home scores (School Climate) Middle High School School Safety 13. Students feel safe. Fairness of Rules 18. The school s Code of Conduct is fair. Parent Satisfaction 9. I am satisfied with the education students get in this school. 96.9 88.8 82.3 97.8 94.5 85.2 94.2 89.6 80.6
Positive, Punitive and Social-Emotional Learning Techniques Scale
Techniques 2018 Student Responses
Disciplinary Techniques by Student Grade Level Students in middle and high school tend to perceive less use of positive and SEL techniques and greater use of punitive techniques than elementary students. Positive Techniques Punitive Techniques SEL Techniques
Percent who Agreed or Agreed a lot Sample subscale responses associated with student scores (Techniques) Elem School Middle School High School Use of Positive Behavioral Techniques 2. Students are praised often. 5. Students are often given rewards for being good. Use of Punitive Techniques* 4. Students are often sent out of class for breaking rules. 13. Students are punished too much for minor things. Use of SEL Techniques 3. Students are taught to feel responsible for how they act. 12. Students are taught how to solve conflicts with others. * = A high score on this subscale is negative because items are negatively worded. 81.0 80.1 54.8 54.3 40.9 30.8 51.3 72.1 58.6 30.2 49.8 55.3 90.9 82.3 76.0 87.0 64.3 49.4
Techniques 2018 Teacher/Staff Results
Techniques by Teacher Grade Level In contrast to students, teachers/staff consistently report low use of punitive techniques & high use of positive and SEL techniques. Use of positive techniques decreases from elementary to high school. Positive Techniques Punitive Techniques SEL Techniques
Percent who Agreed or Agreed a lot Sample subscale responses associated with staff/teacher scores (Techniques) Elem School Middle School High School Use of Positive Behavioral Techniques 2. Students are praised often. 11. Classes get rewards for good behavior Use of Punitive Techniques* 7. Students are often yelled at by adults. 10. Many students are sent to the office for breaking rules. Use of SEL Techniques 3. Students are taught to feel responsible for how they act. 15. Students are taught they should care about how others feel. * = A high score on this subscale is negative because items are negatively worded. 96.9 89.8 89.8 70.1 83.3 50.3 10.1 16.8 20.7 30.7 12.3 27.1 90.4 74.6 70.0 94.4 80.2 74.6
Bullying Victimization Scale 2018 Student Results
Bullying Victimization Scale Students asked to respond to 12 statements about the extent to which he/she was bullied, including: 4 physical statements 4 verbal statements 4 social bullying statements Students in grades 6-12 also given 4 statements about cyber bullying Students responded on a 6-point scale: 1 = Never 2 = Less than once a month 3 = Once or twice a month 4 = Once a week 5 = Several times a month 6 = Every day
Bullying Victimization by Student Grade Level Elementary students tend to view verbal bullying as occurring more frequently than other types of bullying. Overall, students perceive little bullying occurring in elementary school. Verbal Bullying Physical Bullying Social/Relational Bullying
Bullying Victimization by Student Grade Level As in elementary school, students tend to view verbal bullying as occurring most frequently in middle and high school. Overall, students view bullying as occurring rather infrequently (never less than once a month range). Verbal Bullying Physical Bullying Social/Relational Bullying Cyberbullying
Percent who are bullied once a month or more Sample subscale responses associated with student scores (Bullying Victimization*) Elem School Middle School High School Verbal Bullying 4. A student said mean things to me. Physical Bullying 5. I was hit or kicked and it hurt. Social/Relational Bullying 6. A student told/got others not to like me. Cyberbullying 14. A student sent me a mean or hurtful message about me using email, text messaging, instant messaging, or similar electronic messaging. * = A high score on this subscale is negative because items are negatively worded. 28.3 28.2 23.0 12.6 11.1 7.8 16.1 15.5 14.5 N/A 7.2 8.1
Bullying Victimization Scale 2018 Home Results
Bullying Victimization by Student Grade Level Parents tend to view verbal bullying as occurring more frequently than other types of bullying in elementary school. Overall, parents perceive little bullying occurring in elementary school. Verbal Bullying Physical Bullying Social/Relational Bullying
Bullying Victimization by Student Grade Level As in elementary school, parents tend to view verbal bullying as occurring most frequently in middle and high school. Overall, parents view bullying as occurring rather infrequently (never less than once a month range). Verbal Bullying Physical Bullying Social/Relational Bullying Cyberbullying
Percent who are bullied once a month or more Sample subscale responses associated with home scores (Bullying Victimization*) Elem School Middle School High School Verbal Bullying 7. My child was called names he/she didn t like. Physical Bullying 11. A student threatened to harm my child. Social/Relational Bullying 9. A student got others to say mean things about my child. Cyberbullying* 13. Another student sent my child a mean or hurtful message about him/her using email, text messaging, or other electronic messaging. A high score on this subscale is negative because items are negatively worded. *For grades 6-12 only 10.6 14.7 10.4 2.6 4.5 4.1 5.3 8.5 6.8 N/A 3.0 5.1
Student Engagement Scale 2018 Student Results
Student Engagement Grade Level Differences: Student Survey In middle school and high school, students tend to view themselves as being less emotionally engaged than in elementary school. Overall, across grade levels students tend to perceive themselves as being engaged in school. Behavioral Engagement Cognitive Engagement Emotional Engagement
Percent who Agreed or Agreed a lot Sample subscale responses associated with student scores (Student Engagement ) Elem School Middle School High School Behavioral 1. I pay attention in class. 4. I follow the rules at school. Cognitive 2. I try my best in school. 5. I turn in my homework on time. Emotional 3. I feel happy in school 9. I like students who go to this school 94.4 96.0 92.1 91.9 92.6 92.8 98.3 85.7 94.7 77.8 90.1 76.2 84.5 90.3 67.7 78.9 60.7 70.9
Student Engagement Scale 2018 Home Results
Student Engagement Grade Level Differences: Home Survey In middle school and high school, parents tend to view their children as being less emotionally engaged than in elementary school. Overall, across grade levels, parents perceive their children as being engaged in school. Behavioral Engagement Cognitive Engagement Emotional Engagement
Percent who Agreed or Agreed a lot Sample subscale responses associated with home scores (Student Engagement ) Elem School Middle School High School Behavioral 4. My child follows the rules at school. 97.8 97.3 95.2 Cognitive 2. My child tries his/her best in school. 97.0 94.0 88.9 Emotional 3. My child feels happy in this school 94.7 86.2 78.4
Student Social and Emotional Competencies Scale 2018 Student Results
Student Social and Emotional Competencies Scores by Student Grade Level Students across grade levels tend to perceive themselves as possessing social and emotional competence in all 4 areas. Responsible Decision Making Social Awareness Self-Management Relationship Skills
Percent who indicated this was somewhat or very much like them Sample subscale responses associated with student scores (Student Social and Emotional Competencies Scale) Elem School Middle School High School Responsible Decision-making/Responsibility 1. I feel responsible for how I act. 95.2 94.8 96.3 Understanding how others think and feel/Social Awareness 6. I care about how others feel. 93.5 88.1 87.0 Self-management of emotions and behavior 7. I think before I act. 85.8 81.2 87.1 Relationship Skills 4. I am good at solving conflicts with others. 80.9 77.6 85.5
Summary Delaware has developed a reliable and valid measure of school climate and more. Scores on the surveys are reliable and related to important outcomes, particularly academic achievement and suspensions/expulsions. Improvements continue to be made. For additional information & resources visit www.delawarepbs.org