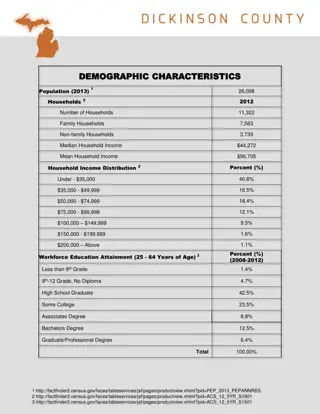
DEMOGRAPHIC CHARACTERISTICS
The content provides detailed demographic characteristics such as population, household distribution, income distribution, and workforce education attainment of an area. Additionally, it outlines the structure of the city and county government, including the number of elected officials, top officials, and details about state government representation with relevant links.

Download Presentation

Please find below an Image/Link to download the presentation.
The content on the website is provided AS IS for your information and personal use only. It may not be sold, licensed, or shared on other websites without obtaining consent from the author.If you encounter any issues during the download, it is possible that the publisher has removed the file from their server.
You are allowed to download the files provided on this website for personal or commercial use, subject to the condition that they are used lawfully. All files are the property of their respective owners.
The content on the website is provided AS IS for your information and personal use only. It may not be sold, licensed, or shared on other websites without obtaining consent from the author.
E N D
Presentation Transcript
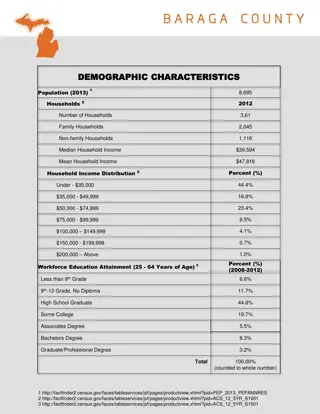
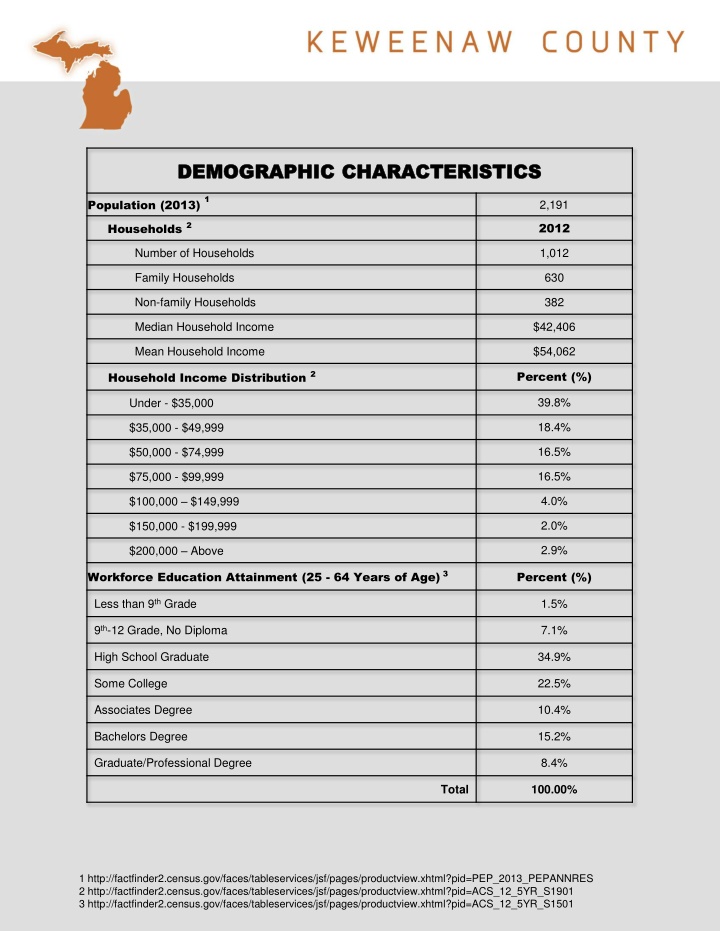
DEMOGRAPHIC CHARACTERISTICS DEMOGRAPHIC CHARACTERISTICS 1 Population (2013) 2,191 Households 2 2012 Number of Households 1,012 Family Households 630 Non-family Households 382 Median Household Income $42,406 Mean Household Income $54,062 Percent (%) Household Income Distribution2 39.8% Under - $35,000 18.4% $35,000 - $49,999 16.5% $50,000 - $74,999 16.5% $75,000 - $99,999 4.0% $100,000 $149,999 2.0% $150,000 - $199,999 2.9% $200,000 Above Workforce Education Attainment (25 - 64 Years of Age)3 Percent (%) Less than 9thGrade 1.5% 9th-12 Grade, No Diploma 7.1% High School Graduate 34.9% Some College 22.5% Associates Degree 10.4% Bachelors Degree 15.2% Graduate/Professional Degree 8.4% Total 100.00% 1 http://factfinder2.census.gov/faces/tableservices/jsf/pages/productview.xhtml?pid=PEP_2013_PEPANNRES 2 http://factfinder2.census.gov/faces/tableservices/jsf/pages/productview.xhtml?pid=ACS_12_5YR_S1901 3 http://factfinder2.census.gov/faces/tableservices/jsf/pages/productview.xhtml?pid=ACS_12_5YR_S1501
GOVERNMENT GOVERNMENT City Government No city governments County Government Form (Structure) # of Elected Officials Top Elected Officials County Commission 5 Chairman of County Commission Don Piche Chairman Randy Eckloff - Vice Chairman Ray Chase - County Commissioner Del Rajala - County Commissioner Frank Stubenrauch - County Commissioner Keweenaw County County Commissioners 1 County Manager (Yes or No) Clerk 2 Equalization 3 No Julie Carlson Tom Novascone 1 http://www.keweenawcountyonline.org/commissions-board.php 2 http://www.keweenawcountyonline.org/department-clerk.php 3 http://www.keweenawcountyonline.org/department-equal.php 4 http://www.keweenawcountyonline.org/department-treasurer.php
GOVERNMENT GOVERNMENT 1 State Government Form (Structure) # of Elected Officials Upper House Representing Area Total Statewide Upper House Lower House Representing Area Total Statewide Lower House State Representative Serving the Area 2 Legislative House District 110 Represents Counties: Baraga, Gogebic, Houghton, Iron, Keweenaw, Marquette, Ontonagon State Senator Serving the Area 3 Legislative Senate District 38 Represents Counties: Alger, Baraga, Delta, Dickinson, Gogebic, Houghton, Iron, Keweenaw, Luce, Marquette, Menominee, Ontonagon, Schoolcraft Governor Name Years in Office Current Term Expiration Date Allowed to Run for Another Term (Yes or No) Next Election Date US Government Representation Congressional Districts Listed by District # in the Service Area (By District) Bicameral 148 1 38 2 110 Scott Dianda Tom Casperson 4 Rick Snyder 2 Jan. 1, 2015 Yes Nov. 4, 2014 5 US Congresspersons Serving the Area Name Years in Office Current Term Expiration Date Next Election Date US Senators Serving Area Name Years in Office Current Term Expiration Date Next Election Date Name Years in Office Current Term Expiration Date Next Election Date Dan Benishek 2 Jan. 3, 2015 Nov. 4, 2014 Carl Levin 34 Jan. 3, 2015 Nov. 4, 2014 Debbie Stabenow 13 Jan. 3, 2018 Nov. 4, 2017 1 http://www.michigan.gov/som/0,4669,7-192-29701_29704---,00.html 2 http://110.housedems.com/ 3 http://www.senatortomcasperson.com/ 4 http://www.michigan.gov/snyder 5 http://www.contactingthecongress.org
QUALITY OF LIFE QUALITY OF LIFE Housing 1 2012 2012 Number of Housing Units 2,462 Occupied Housing Units 1,012 41.1% Vacant Housing Units 1,450 58.9% Homeowner Vacancy Rate 3.0% Median Home Value $99,500 Number of Single Family Homes For Sale by Price 1 Number (#) Percent (%) Less than $50,000 155 17.6% $50,000 - $99,999 288 32.6% $100,000 $149,999 120 13.6% $150,000 - $199,999 91 10.3% $200,000 - $299,999 135 15.3% $300,000 - $499,999 70 7.9% $500,000 - $999,999 19 2.2% $1,000,000 or more 5 0.6% 1 Rentals Average Monthly Gross Median Rent Paid $417 Rental Vacancy Rate 20.9% 1 http://factfinder2.census.gov/faces/tableservices/jsf/pages/productview.xhtml?pid=ACS_12_5YR_DP04
QUALITY OF LIFE QUALITY OF LIFE Culture 1 Event Dates Fat Tire Festival Labor Day Weekend Fishing Tournament Early June Top Events Civil War Encampment July Thunder in the Harbor July, last weekend August, 1st weekend Aspirus Keweenaw Copperman Triathlon Symphony Orchestras Museums Dance Companies Lighthouses # Of Cultural Places & Amenities 6 5-6 classes 1 12 Parks & Beaches Waterfalls Scenic Drives Guided Tours Recreational Outlets 23 10 6 4 Keweenaw Adventure Company, Lac La Belle Lodge, Sand Point Charters, Sunset Bay RV Resort Campground and Cabins, Keweenaw Underwater Preserve, Keweenaw Water Trail, Mount Bohemia, Keweenaw Mountain Lodge & Brockway Mountain Drive 1 http://www.keweenaw.info/activities/
LABOR FORCE CHARACTERISTICS Non-Agricultural Employment Reported by Place of Work Total Number Employed 1 2010 2000 1990 Mining N/A 1 0 Construction 19 26 13 Manufacturing 21 68 47 Public Utilities 52 18 5 Wholesale Trade 19 18 5 Retail Trade 63 182 137 Finance, Insurance & Real Estate N/A 108 52 Service* 169 354 131 Government 169 196 82 971 472 Total 2 Commute Times To Work Time Time Less than 10 Minutes 24.4% 10 19 Minutes 26.3% 20 29 Minutes 23.3% Over 30 Minutes 25.9% Median Travel Time to Work 20.7 minutes 3 Labor Participation Rate Percent (%) Male 48.2% Female 51.8% Total 100% *Services includes Professional, Technical, Scientific, Administrative, Support, Waste and Remediation, Educational, Food and Accommodation, and other services 1 http://headwaterseconomics.org/wphw/wp-content/eps-profiles/26083%20-%20Keweenaw%20County%20MI%20Measures.pdf 2 http://factfinder2.census.gov/faces/tableservices/jsf/pages/productview.xhtml?pid=ACS_12_5YR_DP03 3 http://factfinder2.census.gov/faces/tableservices/jsf/pages/productview.xhtml?pid=ACS_12_5YR_S2401
LABOR LABOR - - MANAGEMENT RELATIONS MANAGEMENT RELATIONS Is the State Right to Work Is the State Right to Work Yes % of Workforce % of Workforce Organized Organized 1 All Workers 16.60% UNIONS UNIONS National Association of Letter Carriers 2 United Steel Workers 2 NALC USW 6 members 182 members Calumet, MI (Houghton County) Calumet, MI (Houghton County) 1 http://www.bls.gov/ro5/unionmi.htm 2 http://www.unions.org/union_search.php?&abbr=&abbr_key=&miles=50&bizcat=0&zip=Copper%20Harbor,%20MI%2049918&local=&zip_key=49918
1 1 TAXATION TAXATION Corporate Income Tax/Franchise Tax State Rate (range) 6% Personal Income Tax State Rate (Range) 4.33% Sales/Use Tax Rate State 6% Sales Tax Rate by Utility Electric Power 4% Natural Gas 4% Fuel Oil .19/gal TOTAL TOTAL PROPERTY TAX RATES PROPERTY TAX RATES TOTAL MILLAGE (2013) 2 Principal Residence or Ag Exemption 23.4775 Industrial Personal Commercial Personal Keweenaw County Townships Non Homestead Allouez 41.0097 17.4775 29.0097 Village of Ahmeek 34.2663 51.7985 28.2663 39.7985 Eagle Harbor 25.4810 43.0132 19.4810 31.0132 Grant 24.0421 29.2091 18.0421 24.0421 Houghton 24.3791 41.9113 18.3791 29.9113 Sherman 27.4961 45.4961 21.4961 33.4961 1 http://www.michiganbusiness.org/site-selection/commercial-real-estate-database/ 2 http://www.michigan.gov/documents/taxes/2013_Total_Rates_450527_7.pdf
ENVIRONMENTAL ENVIRONMENTAL 1 Area in Attainment for Federal Air Pollution Regulations Yes No Ozone X Carbon Monoxide X Particular Matter X Lead X Sulfur Dioxide X Nitrogen Dioxide X State Instituted a One-Stop Air & Water Quality Permitting System X 1 Average Time Average Permit Approval Time From Date of Completed Routine Application* Air Permit 30-60 days Water Permit 32 days Hazardous Waste Permit 140 days Projected Projected Years of Years of Remaining Remaining Capacity Capacity Capacity Capacity Remaining Remaining (Cubic Yards) (Cubic Yards) Name of Agency Name of Agency Address Address Phone Phone Landfill Landfill Contact Contact Information Information 2 2 11877 State Hwy M38 Ontonagon, MI 49953 (906) 883-3504 K & W Landfill 2,042,396 20 years 3 1 2 3 http://www.deq.state.mi.us/aps/downloads/rop/pub_ntce/N6035/N6035%20Staff%20Report%2011-28-12.pdf http://www.michigan.gov/documents/deq/DEQ-OWMRP-SWS-SolidWasteAnnualReportFY2013_447054_7.pdf http://www.yellowpages.com/ontonagon-mi/mip/k-w-landfill-inc-452933282