Demographic Dividend Monitoring in Nigeria
The Demographic Dividend Perception and Outcome Monitoring Index for Nigeria provides a comprehensive framework to monitor progress towards sustainable generational economies. It assesses thematic pillars such as health, education, employment, governance, and evidence building. The index integrates with national roadmaps and global agendas like the AU Agenda 2063 and SDGs, emphasizing the importance of harnessing demographic dividends for national development. Key stages include activity delivery, budget integration, profile estimation, and roadmap development.

Download Presentation

Please find below an Image/Link to download the presentation.
The content on the website is provided AS IS for your information and personal use only. It may not be sold, licensed, or shared on other websites without obtaining consent from the author.If you encounter any issues during the download, it is possible that the publisher has removed the file from their server.
You are allowed to download the files provided on this website for personal or commercial use, subject to the condition that they are used lawfully. All files are the property of their respective owners.
The content on the website is provided AS IS for your information and personal use only. It may not be sold, licensed, or shared on other websites without obtaining consent from the author.
E N D
Presentation Transcript
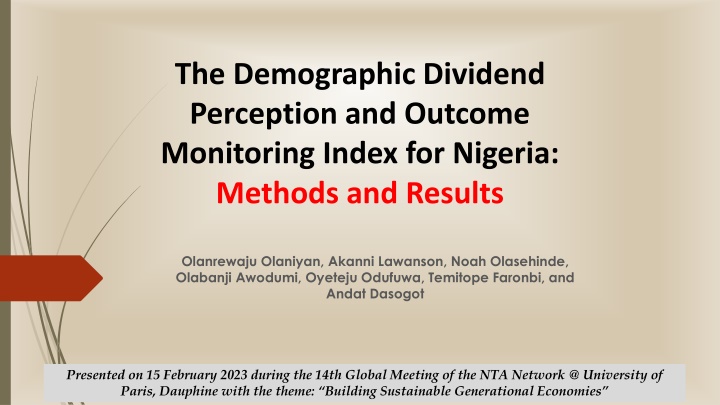
The Demographic Dividend Perception and Outcome Monitoring Index for Nigeria: Methods and Results Olanrewaju Olaniyan, Akanni Lawanson, Noah Olasehinde, Olabanji Awodumi, Oyeteju Odufuwa, Temitope Faronbi, and Andat Dasogot Presented on 15 February 2023 during the 14th Global Meeting of the NTA Network @ University of Paris, Dauphine with the theme: Building Sustainable Generational Economies
Outline of Presentation 2 Introduction Why the DDMI for Nigeria? Components of the Demographic Dividend Monitoring Index Methodology of the Demographic Dividend Results Conclusion
Introduction 3 The Demographic Dividend Monitoring Index (DDMI) is the Monitoring and Evaluation (M&E) framework computed to directly monitor the thematic pillars of the national roadmap. provides a performance matrix to identify areas of strengths and areas for rigorous policy attention. tracks the progress made towards creating and harnessing the DD. reinforces the country s efforts towards achieving the: AU Agenda (2063) Global Agenda (2030- SDGs).
Stages of Delivering Demographic Dividend Activities Demographic Dividend Monitoring Index Integration with Budgeting and Development Plans Estimation of Demographic Dividend Profiles Demographic Dividend Roadmap
Why the DDMI for Nigeria? 5 To showcase DD programme progress. To draw attention of policymakers, non-governmental organisations and development practitioners to harness the dividends. To create opportunities for exchange of expertise and knowledge To highlight governments /development partners responsibilities For resource mobilisation, management and utilization To generate transparency and accountability enhancing To assisting in exposing missteps and offer way out for learning and improvements.
Thematic Pillars of the Nigerian DD Roadmap 6 Pillar 1 Health (including family planning) and Well-being Pillar 2 Education and Skill Development Pillar 3 Employment and Entrepreneurship Pillar 4 Governance and Youth Participation Pillar 5 Practical Evidence Building on Demographic Dividend
Linkages among the DDMI (Pillars of the Nigeria DD Roadmap), AU Roadmap, UNFPA WCARO Programming Guide and SDGs 7 Nigeria Roadmap/ DDMI Dimensions UNFPA WCARO AU Roadmap SDGs Programming Guide Axis 1: Demography and Human Development Pillar 3: Pillar/Dimension 1: Health and Wellbeing Goal 2, 3,5, 6, 7, 12, 13 Axis 4: Health and Family Planning Health and Well-being Axis 8: Socioeconomic Environment Axis 1: Demography and Human Development Pillar/Dimension 2: Education and Skill Development Pillar 2: Education and Skill Development Axis 3: Education Goal 1, 4, 5, 8 Axis 8: Socioeconomic Environment Axis 1: Demography and Human Development Pillar/Dimension 3: Employment and Entrepreneurship Pillar 1: Employment and Entrepreneurship Goal 1, 2, 5, 8, 9, 10, 12 Axis 5: Youth Empowerment Axis 8: Socioeconomic Environment Axis 1: Demography and Human Development Pillar 4: Pillar/Dimension 4: Governance and Youth Participation Goal 5, 9, 10, 11, 13, 16 Axis 6: Gender Equity Rights, Governance and Youth Empowerment Axis 7: Rights and Governance Pillar/Dimension 5: Practical Evidence-Building Pillar 2: Education and Skill Development Axis 1: Demography and Human Development Goal 11, 17
Methodology of the Index Steps in the construction of DDMI Perception Indicators (110) Subdomains (0) Domains (22) Dimensions (5) Outcome Indicators (90) Subdomains (16) Domains (24) Dimensions (5)
Methodology of the Index Outcome Perception S/N Dimension Domain Indicators Domain Sub-Domain Indicators 1 7 35 7 4 21 Health and Wellbeing Education and Skill Development 2 3 15 3 7 20 Employment and Entrepreneurship 3 3 15 4 2 14 Governance and Youth Participation Practical Evidence- Building on DD 4 4 20 5 3 26 5 5 25 5 - 9 22 110 24 16 90 Total
10 Data and Sources Data for the indicators utilized were sourced from both domestic and international databases for 2021/2022. These are official databases that are reliable, publicly available and easily accessible (DHS, MICS, Digest of Education Statistics, WASH-NORM NBS, CBN, Worldbank, etc) Selected indicators and data are validated through the National Transfer Account Global Network. All indicators are adjusted and normalized to ensure that they all have common units
11 Weights Weights are assigned to Dimensions, Domains, Subdomains and Indicators based on: relative importance in DD achievement peculiarity to the entity context and closeness to the Agenda 2030 and 2063 Dimension 1 2 3 4 5 Total Weight 28 22 35 10 5 100 Range: DDMI ranges from worst (0) to best (100)
12 Classification of the Performance of the various indicators with the DDMI Index Score Performance 81 - 100 Optimal progress 61 - 80 Good progress Average progress (intervention needs to be scaled up) Deficient (Intervention required) Critically Deficient (Serious Intervention required) 41 - 60 21 - 40 0 - 20
13 Health and Wellbeing Perception Outcome 51.2 44.1 Health and Wellbeing Health and Wellbeing Water and Sanitation Water and Sanitation 58.8 91.9 Nutrition Nutrition 51.7 56.0 Housing Family Planning 51.3 46.2 Health Quality Child health 51.3 38.7 Child health Reproductive health 50.0 29.1 Family Planning Housing 49.1 28.8 Reproductive health Health Quality 47.3 11.4 0.0 Average Average 20.0 40.0 60.0 80.0 0.0 20.0 40.0 60.0 80.0 100.0 Average Average
14 Education and Skill Development Perception Outcome Education and Skills Development Education and Skills Development 50.3 54.0 Quality Quality 53.0 72.6 Access Access 50.9 52.4 Skill Development Skill Development 46.4 38.5 42.0 44.0 46.0 48.0 50.0 52.0 54.0 0.0 20.0 40.0 60.0 80.0 Average Average Average Average
15 Employment and Entrepreneurship Perception Outcome Employment and Entrepreneurship Employment and Entrepreneurship 38.3 50.4 Total Employment 56.3 Entrepreneurship 52.9 Entrepreneurship 46.6 Poverty Reduction 49.8 Poverty Reduction 42.0 Total Employment 48.6 Economic Dependency 30.1 46.0 48.0 50.0 52.0 54.0 0.0 10.0 20.0 30.0 40.0 50.0 60.0 Deficient Deficient Average Average
16 Governance and Youth Participation Perception Outcome Governance and Youth Participation Governance and Youth Participation 45.8 51.4 Youth Participation 66.7 Youth Participation 55.9 Public Accountability Mechanism 55.6 Control of Corruption 51.7 Control of Corruption 42.4 Social Protection 50.0 Security 39.7 Security 49.9 Social Protection 38.6 46.0 48.0 50.0 52.0 54.0 56.0 58.0 0.0 Average Average 20.0 40.0 60.0 80.0 Average Average
17 Practical Evidence Building on DD Perception Outcome 52.1 19.8 Practical Evidence-Building Practical Evidence-Building Roadmap Adovacy 56.8 66.7 Development Plans and Budgets Integration Data and Profile Estimation 52.9 30.9 Monitoring Index and Observatory Roadmap 50.9 18.4 Development Plans and Budgets Integration Data and Profile Estimation 50.9 3.9 Monitoring Index and Observatory Adovacy 49.1 2.6 45.0 50.0 55.0 60.0 0.0 20.0 40.0 60.0 80.0 Critically Deficient Critically Deficient Average Average
18 DEMOGRAPHIC DIVIDEND Perception Health and Wellbeing Outcome Health and Wellbeing 50.8 43.0 44.1 51.2 Practical Evidence- Building on DD Education and Skill Developm ent Practical Evidence- Building on DD Education and Skill Developm ent 54.0 50.3 19.8 52.1 50.4 38.3 Governan ce and Youth Participati on Governan ce and Youth Participati on Employme nt and Entrepren eurship Employme nt and Entrepren eurship 51.4 45.8 Average Average Average Average
CONCLUSION 19 The DDMI is a strategic tool for monitoring indicators and progress towards harnessing the Demographic Dividend. The overall performance of the country based on the 5 DD outcome indices is 43.0% while stakeholders perceived it to be 50.8%, indicating that demographic dividend intervention in the country needs to be scaled up. While some progress have being recorded, efforts are still far from enough in all dimensions of DD. It is believed that relevant government ministry or department should take ownership of the index which will be resident in a National Observatory office thereby serving as a tool for decision-making and guidance for development planning.
20 Thank you for your attention Health Policy Training And Research Programme (HPTRP) University of Ibadan, Nigeria


,")