Demographic Losses in Ukraine and Ireland: Insights from Academic Conference
Explore the demographic losses of Ukraine and Ireland presented at an international academic conference. The analysis includes direct losses like excess deaths and migration, as well as indirect losses such as deficits in births. Gain insights into historical trends and numbers for a deeper understanding of these populations.
Uploaded on | 1 Views
Download Presentation

Please find below an Image/Link to download the presentation.
The content on the website is provided AS IS for your information and personal use only. It may not be sold, licensed, or shared on other websites without obtaining consent from the author. If you encounter any issues during the download, it is possible that the publisher has removed the file from their server.
You are allowed to download the files provided on this website for personal or commercial use, subject to the condition that they are used lawfully. All files are the property of their respective owners.
The content on the website is provided AS IS for your information and personal use only. It may not be sold, licensed, or shared on other websites without obtaining consent from the author.
E N D
Presentation Transcript
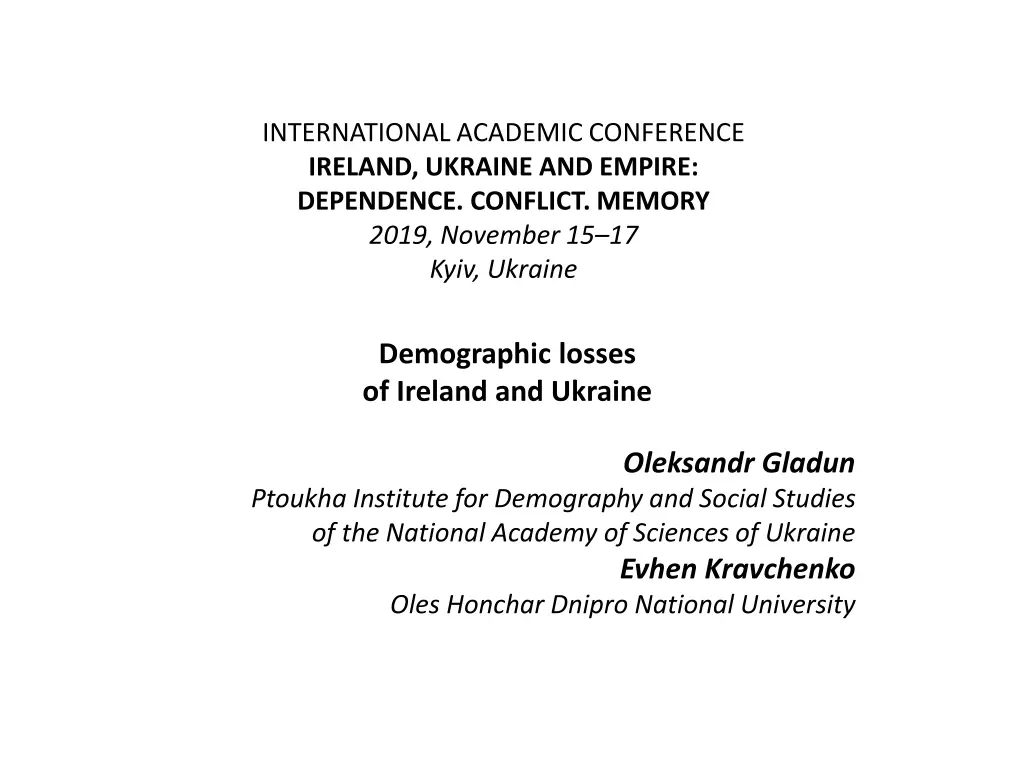
INTERNATIONAL ACADEMIC CONFERENCE IRELAND, UKRAINE AND EMPIRE: DEPENDENCE. CONFLICT. MEMORY 2019, November 15 17 Kyiv, Ukraine Demographic losses of Ireland and Ukraine Oleksandr Gladun Ptoukha Institute for Demography and Social Studies of the National Academy of Sciences of Ukraine Evhen Kravchenko Oles Honchar Dnipro National University
Structure of the demographic losses Demographic losses: - direct losses: excess deaths migration losses - indirect losses (deficit of births)
Excess deaths Excess deaths are estimated as the difference between the actual (reconstructed) numbers of deaths and its hypothetical numbers assuming there was no catastrophic event excess mortality linear trend of mortality
Deficit of births Deficit of births are estimated as the difference between the hypothetical numbers assuming there was no catastrophic event and actual (reconstructed) numbers of births deficit of births linear trend of births
Number of emigrants from Ireland, 1841 1861, in 1,000s 350 300 250 200 150 100 50 0 emigration "normal" level of emigration
Net migration in Ukraine, 1927 1938, in 1,000s 100 50 0 1927 1928 1929 1930 1931 1932 1933 1934 1935 1936 1937 1938 -50 -100 -150 -200 -250 -300 net migration average annual net migration
Demographic losses, in absolute numbers Ukraine Ireland direct losses excess deaths migration losses 3,9 millions net migration 183 thousands 1 million emigration 1,2 millions indirect losses (deficit of births) 600 thousands 300 thousands
Excess deaths in Ukraine, 1932 1934, per 1000 population 140 120 100 80 60 40 20 0 1932 1933 1934 "normal" level of deaths excess deaths
Age-sex structure of excess deaths, Ukraine, 1932-1934, % men women 75 75 70 70 65 65 60 60 55 55 50 50 45 45 age age 40 40 35 35 30 30 25 25 20 20 15 15 10 10 5 5 0 0 3.00 2.00 1.00 0.00 1.00 2.00 3.00
Demographic losses, relative to the population before the famine Ukraine Ireland years 1932- 1934 1932- 1933 1932- 1934 % years 1845- 1849 1845- 1854 1845- 1849 % excess deaths migration losses deficit of births 13,0 12,1 0,4 14,5 1,9 3,6
Population of Ireland, 1821 1914, in millions 9 8 7 6 5 4 3 2 1 0 1911 1821 1824 1827 1830 1833 1836 1839 1842 1845 1848 1851 1854 1857 1860 1863 1866 1869 1872 1875 1878 1881 1884 1887 1890 1893 1896 1899 1902 1905 1908 1914
Population of Ukraine, 1927 1959, in millions 34 32 30 28 26 24 22 20 1928 1927 1929 1930 1931 1932 1933 1934 1935 1936 1937 1938 1939 1940 1941 1942 1943 1944 1945 1946 1947 1948 1949 1950 1951 1952 1953 1954 1955 1956 1957 1958 1959 Ukraine in borders as of 1933
