Demographic Transition and Challenges in Iran
Explore the demographic transition and challenges faced in Iran, as discussed by Mohammad Jalal Abbasi-Shavazi, an expert in demography. Discover insights on age structural changes, demographic dividends, and societal impacts.

Download Presentation

Please find below an Image/Link to download the presentation.
The content on the website is provided AS IS for your information and personal use only. It may not be sold, licensed, or shared on other websites without obtaining consent from the author. If you encounter any issues during the download, it is possible that the publisher has removed the file from their server.
You are allowed to download the files provided on this website for personal or commercial use, subject to the condition that they are used lawfully. All files are the property of their respective owners.
The content on the website is provided AS IS for your information and personal use only. It may not be sold, licensed, or shared on other websites without obtaining consent from the author.
E N D
Presentation Transcript
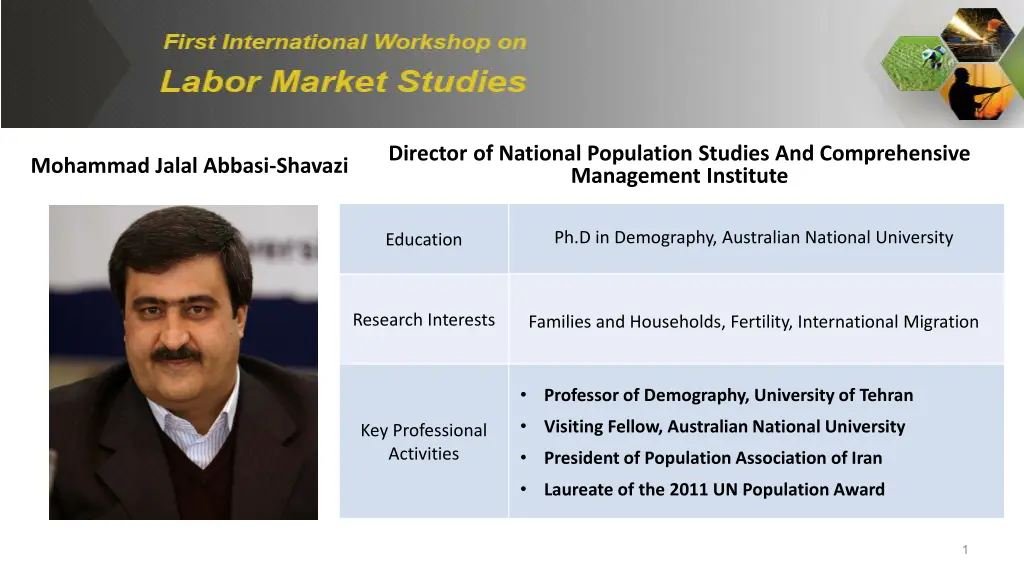
Director of National Population Studies And Comprehensive Management Institute Mohammad Jalal Abbasi-Shavazi Ph.D in Demography, Australian National University Education Research Interests Families and Households, Fertility, International Migration Professor of Demography, University of Tehran Visiting Fellow, Australian National University Key Professional Activities President of Population Association of Iran Laureate of the 2011 UN Population Award 1
Age Age- -Structural Changes and Demographic Window in Iran: Structural Changes and Demographic Window in Iran: Opportunities and Challenges Opportunities and Challenges Mohammad Jalal Abbasi-Shavazi Rasoul Sadeghi Meimanat Hosseini Chavoshi 2-3 September 2017 2
OUTLINE OUTLINE Demographic Transition in Iran Age structural change Demographic window in Iran Age-structural and educational composition Is the demographic window seized? Unemployment Women s employment Brain Drain Conclusions Introduction: Demographic Dividend National Population Studies And Comprehensive Management Institute 3 M. J. Abbasi-Shavazi, R. Sadeghi, M. Hosseini Chavoshi
DEMOGRAPHIC TRANSITIONS ARE COMPLEX AND INTERRELATED DEMOGRAPHIC TRANSITIONS ARE COMPLEX AND INTERRELATED Weeks, 2012 M. J. Abbasi-Shavazi, R. Sadeghi, M. Hosseini Chavoshi Impact on Society Impact on Society National Population Studies And Comprehensive Management Institute 4
First Demographic Dividend First Demographic Dividend At an early stage of [demographic] transition, fertility rates fall, leading to fewer young mouths to feed. During this period, the labor force temporarily grows more rapidly than the population dependent on it, freeing up resources for investment in economic development and family welfare. The first demographic dividend is transitory because, eventually, the population of working age ceases to increase. -- Lee and Mason (2006) National Population Studies And Comprehensive Management Institute 5 M. J. Abbasi-Shavazi, R. Sadeghi, M. Hosseini Chavoshi
Second Demographic Dividend Second Demographic Dividend A second dividend is also possible. A population concentrated at older working ages and facing an extended period of retirement has a powerful incentive to accumulate assets unless it is confident that its needs will be provided for by families or governments. -- Lee and Mason (2006) National Population Studies And Comprehensive Management Institute 6 M. J. Abbasi-Shavazi, R. Sadeghi, M. Hosseini Chavoshi
Demographic dividend or education dividend? Demographic dividend or education dividend? The beneficial effect of change in age structure after a decrease fertility has become known as demographic dividend. Yet, the possibility of the effect owing to educational change rather than age structure change is under question. Recent studies by Lutz et all (2013) has shown that educational attainment expansions are able to account for the sizable productivity effects that other writers had assumed to be caused by age-structure changes . Thus, improvements in education, rather than fertility declines, are the main driver of subsequent economic growth. These results call into question the notion of a demographic window opening and closing (Lutz, 2014: 530). M. J. Abbasi-Shavazi, R. Sadeghi, M. Hosseini Chavoshi National Population Studies And Comprehensive Management Institute Source: Lutz (2014: 30) 7
What Do We Know About Demographic Transition in Iran? National Population Studies And Comprehensive Management Institute 8 M. J. Abbasi-Shavazi, R. Sadeghi, M. Hosseini Chavoshi
Trend of population number and growth rate in Iran, Trend of population number and growth rate in Iran, 1880 1880- -2011 2011 National Population Studies And Comprehensive Management Institute 9 M. J. Abbasi-Shavazi, R. Sadeghi, M. Hosseini Chavoshi
Total Fertility Trends by rural and urban areas in Iran, Total Fertility Trends by rural and urban areas in Iran, 1972 1972- -2011 2011 9 8 7 6 5 4 3 2 1 0 1972 1974 1978 Total 1986 Census Total 1996 Census Total 2006 Census Total 2011 Census 1984 1988 1990 1994 1998 2000 Rural 1986 Census Rural 1996 Census Rural 2006 Census Rural 2011 Census 2004 2010 1976 1980 1982 1986 1992 1996 2002 2006 2008 Urban 1986 Census Urban 1996 Census Urban 2006 Census Urban 2011 Census National Population Studies And Comprehensive Management Institute 10 M. J. Abbasi-Shavazi, R. Sadeghi, M. Hosseini Chavoshi Ref: Abbasi-Shavazi and Hosseini-Chavoshi, 2014
Age Age- -Specific Fertility Trends in Iran, Specific Fertility Trends in Iran, 1972 1972- -2011 2011 350 300 Per 1000 women aged 15-49 years 250 200 1980 1986 150 1976 1990 100 1996 2000 2006 2011 50 0 15-19 20-24 25-29 30-34 35-39 40-44 45-49 National Population Studies And Comprehensive Management Institute Source: Abbasi-Shavazi, Hosseini-Chavoshi, Banihashemi, and Khosravi (2013). 11 M. J. Abbasi-Shavazi, R. Sadeghi, M. Hosseini Chavoshi Age group
Female Female Singulate Singulate mean age at marriage (SMAM) and age mean age at marriage (SMAM) and age specific percentages married, specific percentages married, 1976 1976- -2006 2006, Iran , Iran Married% 20-24 Year SMAM 15-19 25-29 1976 19.7 34.3 78.6 93.2 1986 19.8 33.5 79.6 90.6 1996 22.4 18.6 60.7 85.2 2006 23.3 16.9 50.3 75.9 2011 23.4 21.4 52.9 73.8 National Population Studies And Comprehensive Management Institute 12 M. J. Abbasi-Shavazi, R. Sadeghi, M. Hosseini Chavoshi
Fertility and Mortality Trends 90 8 80 7 70 6 e0 TFR (medium variant) Total Fertility Rate (per woman) 60 Life Expectancy at birth 5 50 4 40 TFR low variant) TFR high variant) 3 30 2 20 1 10 0 0 National Population Studies And Comprehensive Management Institute 13 M. J. Abbasi-Shavazi, R. Sadeghi, M. Hosseini Chavoshi
Population and Age Structural Transition in Iran National Population Studies And Comprehensive Management Institute 14 M. J. Abbasi-Shavazi, R. Sadeghi, M. Hosseini Chavoshi
Iran Iran s age structure, s age structure, 1986 1986 Male Female 80-84 75-79 70-74 65-69 60-64 55-59 50-54 45-49 40-44 35-39 30-34 25-29 20-24 15-19 10-14 5- 9 0- 4 10 8 6 4 2 0 2 4 6 8 10 National Population Studies And Comprehensive Management Institute 15 M. J. Abbasi-Shavazi, R. Sadeghi, M. Hosseini Chavoshi M. J. Abbasi-Shavazi, R. Sadeghi, M. Hosseini Chavoshi
IRAN IRAN S AGE TRANSITIONS, S AGE TRANSITIONS, 2011 2011- -2051 2051 National Population Studies And Comprehensive Management Institute 16
Iran Iran s age pyramid, s age pyramid, 2016 2016 National Population Studies And Comprehensive Management Institute 17 M. J. Abbasi-Shavazi, R. Sadeghi, M. Hosseini Chavoshi
Iran Iran s age transitions, s age transitions, 2011 2011- -2051 2051 Males Females 80+ 75-79 Window of Opportunity 70-74 65-69 2051 60-64 55-59 50-54 45-49 40-44 35-39 30-34 25-29 20-24 15-19 10-14 5- 9 0- 4 5000 4000 3000 2000 1000 0 1000 2000 3000 4000 5000 Numbers (Thousands) National Population Studies And Comprehensive Management Institute 18 M. J. Abbasi-Shavazi, R. Sadeghi, M. Hosseini Chavoshi
Child and Old Dependency Ratios, 1950-2100 160 140 Child DP Old DP 120 100 80 60 40 20 0 National Population Studies And Comprehensive Management Institute 19 M. J. Abbasi-Shavazi, R. Sadeghi, M. Hosseini Chavoshi
Demographic Window of Opportunity, Opening and Closing Time 70 65 60 55 Percent 50 45 40 0-19 & 65+ 20-64 35 30 25 20 National Population Studies And Comprehensive Management Institute 20 M. J. Abbasi-Shavazi, R. Sadeghi, M. Hosseini Chavoshi
Per capita Labor Income and total Consumption, Age Profile, Iran, 2012 80 Per capita Labour Income 70 Per capita Consumption 60 50 Million IRial 40 30 20 10 0 0 5 10 15 20 25 30 35 40 45 50 55 60 65 70 75 80 85 90 Age National Population Studies And Comprehensive Management Institute 21 M. J. Abbasi-Shavazi, R. Sadeghi, M. Hosseini Chavoshi
Working age population Human Capital Mean years of schooling National Population Studies And Comprehensive Management Institute 22 M. J. Abbasi-Shavazi, R. Sadeghi, M. Hosseini Chavoshi
Increased education and human capital dynamics in Iran Increased education and human capital dynamics in Iran National Population Studies And Comprehensive Management Institute 23 M. J. Abbasi-Shavazi, R. Sadeghi, M. Hosseini Chavoshi
Increased mean years of schooling in Iran, Increased mean years of schooling in Iran, 1970 1970- -2030 2030 12 11 10 9 8 7 6 5 4 3 2 1 0 15-19 20-24 25-29 30-34 35-39 40-44 45-49 50-54 55-59 60-64 65+ 1350 1380 1410 11 10 9 8 7 6 5 4 3 2 1 0 15-19 20-24 25-29 30-34 35-39 40-44 45-49 50-54 55-59 60-64 65+ National Population Studies And Comprehensive Management Institute 24 M. J. Abbasi-Shavazi, R. Sadeghi, M. Hosseini Chavoshi 1410 1350 1380
Internet users (per Internet users (per 100 countries countries 1990 1990- -2015 100 100 people) people) Muslim 2015 Muslim- -majority majority Bahrain, 93.5 Qatar, 92.9 90 United Arab Emirates, 91.2 80 70 60 Turkey, 53.7 50 Iran, Islamic Rep., 44.1 40 30 Indonesia, 22.0 20 Pakistan, 18.0 Bangladesh, 14.4 10 0 Somalia, 1.8 1991199219931994199519961997199819992000200120022003200420052006200720082009201020112012201320142015 National Population Studies And Comprehensive Management Institute 25 M. J. Abbasi-Shavazi, R. Sadeghi, M. Hosseini Chavoshi
Low Female Low Female Labour 2016 2016 Labour Force Participation in Iran, Force Participation in Iran, 2006 2006- - 70 64.1 63.9 63.5 63.2 63 62.8 62.5 62.1 61.9 61.2 60.7 60 50 40 30 16.4 20 15.6 14.9 14.5 14.1 13.7 13.6 13.3 12.6 12.4 12 10 0 1385 1386 1387 1388 1389 1390 1391 1392 1393 1394 1395 National Population Studies And Comprehensive Management Institute 26 M. J. Abbasi-Shavazi, R. Sadeghi, M. Hosseini Chavoshi
Unemployment among youth in Iran, Unemployment among youth in Iran, 2006 2006- -2016 2016 45 42.3 40.6 40.2 40.1 39.7 39.1 40 38.1 35 31.8 31 29.5 29.5 30 25.9 25.5 25.3 24.4 25 23.3 22.1 21.9 21.2 20.8 20.4 20 20 22.1 21.8 21.4 20.8 19.7 19.1 18.2 15 17.8 17.4 17.3 17 10 5 0 1385 1386 1387 1388 1389 1390 1391 1392 1393 1394 1395 National Population Studies And Comprehensive Management Institute 27 M. J. Abbasi-Shavazi, R. Sadeghi, M. Hosseini Chavoshi
Unemployment by Education, Unemployment by Education, 2011 2011 60 50 49.8 48 40 37 35.2 30 30.4 30.1 29.4 26.8 22.8 20 22.3 21.4 20.6 19.5 19.5 18.7 10 0 National Population Studies And Comprehensive Management Institute 28 M. J. Abbasi-Shavazi, R. Sadeghi, M. Hosseini Chavoshi
Population and Employment (Shaded) Age Pyramid, Iran, 2011 Male Female 65+ 60-64 55-59 50-54 45-49 40-44 35-39 30-34 25-29 20-24 15-19 10-14 5- 9 0- 4 5000000 4000000 3000000 2000000 1000000 0 1000000 2000000 3000000 4000000 5000000 National Population Studies And Comprehensive Management Institute 29 M. J. Abbasi-Shavazi, R. Sadeghi, M. Hosseini Chavoshi
Human Capital Waste Human Capital Waste High Unemployment And Low FLFP Low GDP Youth migration and Brain Drain Human capital waste National Population Studies And Comprehensive Management Institute 30 M. J. Abbasi-Shavazi, R. Sadeghi, M. Hosseini Chavoshi
Experiences in reaping DD in other countries: Experiences in reaping DD in other countries: Demographic Miracle to Demographic Waste Demographic Miracle to Demographic Waste Demographic Miracle in South East Asia 31 % of GDP due to DD (Bloom and Williamson 1998) Impact of demographic window on high economic growth in Japan (Ogawa 2005). Economic waste High unemployment and ow economic growth during demographic winder (Bloom et al. 2001). Note: experiencing demographic dividend does not automatically lead to economic growth, and it depends upon the institutional and political context, designing and implementing relevant polices to read the dividend. National Population Studies And Comprehensive Management Institute 31 M. J. Abbasi-Shavazi, R. Sadeghi, M. Hosseini Chavoshi
List of countries and territories by Iranian population List of countries and territories by Iranian population Country United States Iranian-born 283,225 (2000) Residents of Iranian ancestry 448,722 (2010 US Census)to around 1-2 million (2014, USA Government and other sources) ~500,000 (2010) Turkey Qatar UAE Canada Germany 27000 400,000-500,000 (2008) 163,290 (2011) 95,420 (2006) 100,000 - 120,000 (2003) 80,000 (2003) 100000 53,892 (2000) 12,000 (2000) Kuwait Malaysia Sweden Japan 92,428 (2011) 7,000 (2000) National Population Studies And Comprehensive Management Institute 32 M. J. Abbasi-Shavazi, R. Sadeghi, M. Hosseini Chavoshi
List of countries and territories by Iranian population List of countries and territories by Iranian population Country Russia Bahrain Israel United Kingdom Netherlands Australia France Denmark Italy Austria Switzerland Norway New Zealand Spain Portugal Iranian-born Residents of Iranian ancestry 50,000 (2002) 173,000 (2014) 47,800 (2007) 83,000 (2011) 35,561 (2014) 34,455 (2011) 18,376 (2000) 135,000(2007) 36,168 (2011) 8,977 (1991) 7,444 (2010) 16,203 (1.1.2015) 17,000-20,000 (2013) 4,044 (2000) 17,913 (2012) 2,895 (2006) 12,344 (2011) 339 (2011) National Population Studies And Comprehensive Management Institute 33 M. J. Abbasi-Shavazi, R. Sadeghi, M. Hosseini Chavoshi
Iranian migrants in Australia by year of Arrival and sex Iranian migrants in Australia by year of Arrival and sex The The 2011 2011 Australia Census Australia Census 3 Thousands 2.5 2 1.5 1 0.5 0 <1970 1977 1982 2003 1970 1971 1972 1973 1974 1975 1976 1978 1979 1980 1981 1983 1984 1985 1986 1987 1988 1989 1990 1991 1992 1993 1994 1995 1996 1997 1998 1999 2000 2001 2002 2004 2005 2006 2007 2008 2009 2010 National Population Studies And Comprehensive Management Institute 34 M. J. Abbasi-Shavazi, R. Sadeghi, M. Hosseini Chavoshi
Age structure of Iranian migrants in Australia Age structure of Iranian migrants in Australia The The 2011 2011 Australia Census Australia Census Age 90 84 Male Female 78 72 66 60 54 48 42 36 30 24 18 12 6 0 650 550 450 350 250 150 50 50 150 250 350 450 550 650 National Population Studies And Comprehensive Management Institute 35 M. J. Abbasi-Shavazi, R. Sadeghi, M. Hosseini Chavoshi
Iranian migrants in Australia by highest level of education Iranian migrants in Australia by highest level of education (% among those stated their education level) (% among those stated their education level) The The 2011 2011 Australia Census Australia Census No tertiary education 56.1 22.5 15.0 18.3 26.0 31.1 34.0 32.6 37.3 57.6 Tertiary education: Certificate/ Graduate diploma 9.6 7.5 6.0 7.6 12.1 17.2 16.0 11.0 9.1 5.4 Tertiary education: Bachelor, Master, PhD 34.3 70.0 78.9 74.1 61.9 51.7 50.0 56.4 53.5 37.1 Age Total 100.0 100.0 100.0 100.0 100.0 100.0 100.0 100.0 100.0 100.0 20-24 25-29 30-34 35-39 40-44 45-49 50-54 55-59 60-64 65+ National Population Studies And Comprehensive Management Institute 36 M. J. Abbasi-Shavazi, R. Sadeghi, M. Hosseini Chavoshi
Iranian migrants Iranian migrants 20 education and the field of qualification education and the field of qualification (% among those stated their education level) The The 2011 2011 Australia Census Australia Census 20 years or more in Australia by having tertiary years or more in Australia by having tertiary (% among those stated their education level) Engineering and Related Technologies 22.9 Health 13.7 Management and Commerce 13.6 Society and Culture 11.4 Information Technology 8.3 Natural and Physical Sciences 7.2 Has tertiary education 71% Does not have tertiary education 29% Architecture and Building 4.7 Creative Arts 3.7 Education 3.3 Food, Hospitality and Personal Services 3.0 Agriculture, Environmental 1.5 Mixed Field Programmes 0.3 Inadequately described or not stated 6.6 National Population Studies And Comprehensive Management Institute 37 M. J. Abbasi-Shavazi, R. Sadeghi, M. Hosseini Chavoshi
TAKE TAKE- -HOME MESSAGES HOME MESSAGES Demography matters for the pace of economic development There is potentially a significant demographic dividend (DD) in Iran s future Need for estimating the potential size and impact of Iran s demographic dividend Lack of data, low data quality, and lack of access to data for measuring DD is a challenge National Population Studies And Comprehensive Management Institute 38 M. J. Abbasi-Shavazi, R. Sadeghi, M. Hosseini Chavoshi
TAKE TAKE- -HOME MESSAGES HOME MESSAGES Reaping the DD requires: High employment Women s involvement in labour market Productivity Long term, flexible, coordinated plan and ACTION National Population Studies And Comprehensive Management Institute 39 M. J. Abbasi-Shavazi, R. Sadeghi, M. Hosseini Chavoshi


 Age")