Density-Dependent Growth in Coryphopterus Glaucofraenum Study
This study explores the impact of density on Coryphopterus glaucofraenum, a transparent goby species. The research investigates whether density affects the fish's growth and survival rates, focusing on supply-side population dynamics. By examining how local density influences per-capita growth rates, the study sheds light on the species' ecological dynamics. The experiment involved releasing adults at varying densities onto artificial reefs and monitoring their survival over time. The results indicated a decrease in survival with higher densities, suggesting density-dependent effects on the species. The findings contribute to understanding the ecological interactions of marine populations.

Download Presentation

Please find below an Image/Link to download the presentation.
The content on the website is provided AS IS for your information and personal use only. It may not be sold, licensed, or shared on other websites without obtaining consent from the author.If you encounter any issues during the download, it is possible that the publisher has removed the file from their server.
You are allowed to download the files provided on this website for personal or commercial use, subject to the condition that they are used lawfully. All files are the property of their respective owners.
The content on the website is provided AS IS for your information and personal use only. It may not be sold, licensed, or shared on other websites without obtaining consent from the author.
E N D
Presentation Transcript
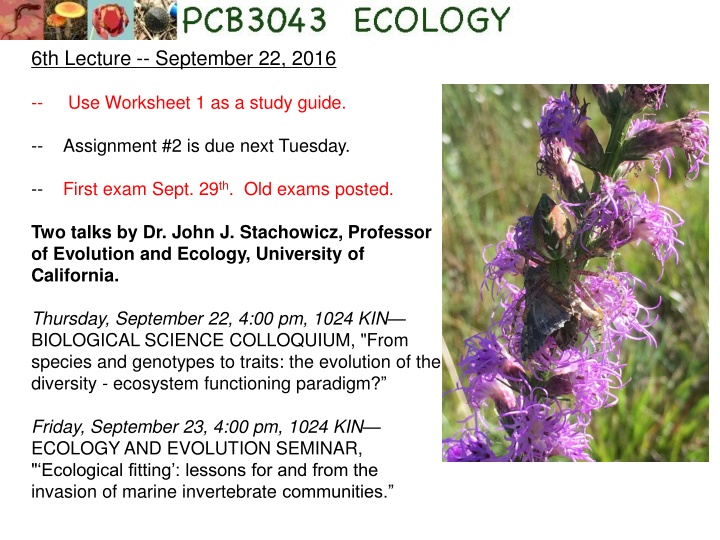
6th Lecture -- September 22, 2016 -- Use Worksheet 1 as a study guide. -- Assignment #2 is due next Tuesday. -- First exam Sept. 29th. Old exams posted. Two talks by Dr. John J. Stachowicz, Professor of Evolution and Ecology, University of California. Thursday, September 22, 4:00 pm, 1024 KIN BIOLOGICAL SCIENCE COLLOQUIUM, "From species and genotypes to traits: the evolution of the diversity - ecosystem functioning paradigm? Friday, September 23, 4:00 pm, 1024 KIN ECOLOGY AND EVOLUTION SEMINAR, " Ecological fitting : lessons for and from the invasion of marine invertebrate communities.
Coryphopterus glaucofraenum or transparent goby Fertilized eggs of this species spend 27 days as larvae floating around the ocean, then appear on reefs at 10-13 mm in length. Adults are territorial and occupy an area of about 1.5 x 1.5 m. Individuals are protogynous hermaphrodites, which means that they are first female, but can later in life turn into males. Males defend nests burrowed in the sand and try to attract females.
The question addressed in this paper is whether or not density affects these fish and, if so, how? It is really addressing whether or not this fish species has density- dependent growth or not. It has been proposed that, for many marine species, local density is determined by the number of larvae that arrive at different sites, rather than local effects of density. This idea is called supply-side population dynamics. Supply-side Density-dependent Per-capita growth rate Per-capita growth rate 2.0 2.0 1.0 1.0 0.0 0.0 0 40 80 0 40 80 Density Density
Coryphopterus glaucofraenum or transparent goby Made 8 artificial reefs using coral rubble. Released adults over a range of densities onto these reefs. The adults are marked with colored tag implants and left for 2.5 months Initial Adult density 1 0.7 Final reef Adult density 0.5 2 1.2 0.5 3 1.4 0.5 4 2.4 0.8 5 3.4 1.1 6 5.1 0.9 7 6.9 2.1 8 10.7 1.3
Coryphopterus glaucofraenum or transparent goby Survival decreases with density. -0.3 Per-capita growth rate -0.4 -0.5 -0.6 -0.7 -0.8 -0.9 2 4 6 8 10 Density
Coryphopterus glaucofraenum or transparent goby
Coryphopterus glaucofraenum or transparent goby
So, is it is supply-side population dynamics? Does density have an effect? How might that effect occur? Supply-side Density-dependent Per-capita growth rate Per-capita growth rate 2.0 2.0 1.0 1.0 0.0 0.0 0 40 80 0 40 80 Density Density
-- density does affect survival, but doesnt affect growth -- so may be due to some density effect through predation, such as a limited number of hiding places, or parasitism. -- also found density-dependent recruitment of new individuals to the reefs. So, is this population density dependent? Does density affect b or d? Or is that too simplistic a view? How about density vague?
II. Tools for Ecology A. Population demography: describing populations. 1. Definitions 2. Demography a. distribution, dispersion, and density b. gender and age c. population growth d. life tables (birth and death of age classes) 1) age groups - x 2) survivorship (opposite of death rate) 3) bx, average births per individual age x. 4) lxbx 5) R0 and G e. projecting population growth from life tables
Life tables do not have densities or abundances (Ns)! They are descriptions of age-specific birth and death, but not direct population dynamics. However, we can now take this life table and predict what will happen to any given population through time. This is a population projection. Age, x 0 1 2 3 4 sums lx mx 0 2.0 1 1 0 lxmx 0 1 0.20 0.10 0 R0= 1.3 xlxmx 0 1 0.4 0.3 0 1.7 1.00 0.50 0.20 0.10 0
Age, x 0 1 2 3 4 sums lx mx 0 2.0 1 1 0 lxmx 0 1 0.20 0.10 0 R0= 1.3 xlxmx 0 1 0.4 0.3 0 1.7 LIFE TABLE 1.00 0.50 0.20 0.10 0 Time 1 2 3 4 5 6 0-1 100 1-2 0 2-3 0 3-4 0 4-5 0 Total N 100 PROJECTION POPULATION
Age, x 0 1 2 3 4 sums lx mx 0 2.0 1 1 0 lxmx 0 1 0.20 0.10 0 R0= 1.3 xlxmx 0 1 0.4 0.3 0 1.7 LIFE TABLE 1.00 0.50 0.20 0.10 0 Time 1 2 3 4 5 6 0-1 100 0 1-2 0 50 2-3 0 0 3-4 0 0 4-5 0 0 Total N 100 50 PROJECTION POPULATION
Age, x 0 1 2 3 4 sums lx mx 0 2.0 1 1 0 lxmx 0 1 0.20 0.10 0 R0= 1.3 xlxmx 0 1 0.4 0.3 0 1.7 LIFE TABLE 1.00 0.50 0.20 0.10 0 Time 1 2 3 4 5 6 0-1 100 0 100 1-2 0 50 0 2-3 0 0 20 3-4 0 0 0 4-5 0 0 0 Total N 100 50 120 PROJECTION POPULATION
Age, x 0 1 2 3 4 sums lx mx 0 2.0 1 1 0 lxmx 0 1 0.20 0.10 0 R0= 1.3 xlxmx 0 1 0.4 0.3 0 1.7 LIFE TABLE 1.00 0.50 0.20 0.10 0 Time 1 2 3 4 5 6 0-1 100 0 100 20 1-2 0 50 0 50 2-3 0 0 20 0 3-4 0 0 0 10 4-5 0 0 0 0 Total N 100 50 120 80 PROJECTION POPULATION
Age, x 0 1 2 3 4 sums lx mx 0 2.0 1 1 0 lxmx 0 1 0.20 0.10 0 R0= 1.3 xlxmx 0 1 0.4 0.3 0 1.7 1.00 0.50 0.20 0.10 0 LIFE TABLE Time 1 2 3 4 5 6 0-1 100 0 100 20 110 40 1-2 0 50 0 50 10 55 2-3 0 0 20 0 20 4 3-4 0 0 0 10 0 10 4-5 0 0 0 0 0 0 Total N 100 50 120 80 140 109 PROJECTION POPULATION
II. Tools for Ecology A. Population demography: describing populations. 1. Definitions 2. Demography a. distribution, dispersion, and density b. gender and age c. population growth d. life tables (birth and death of age classes) 1) age groups - x 2) survivorship (opposite of death rate) 3) mx, average births per individual age x. 4) lxmx 5) R0 and G e. projecting population growth from life tables STABLE AGE DISTRIBUTION using R0 assumes that the population has achieved a stable age distribution.
1400000 1200000 The methods for determining R0 and G only are appropriate when the population is at the stable age distribution. 1000000 Total N 800000 600000 400000 200000 0 1.2 0 5 10 15 20 25 If survivorship and fertility stay constant, then the % of individuals in each age class stabilize, These are collectively the stable age distribution. Time 1 0.8 Percent of Total 0.6 0.4 0.2 0 0 5 10 15 20 25 -0.2 Time
II. Tools for Ecology A. Population demography: describing populations. 1. Definitions 2. Demography a. distribution, dispersion, and density b. gender and age c. population growth d. life tables (birth and death of age classes) 1) age groups - x 2) survivorship (opposite of death rate) 3) mx, average births per individual age x. 4) lxmx 5) R0 and G e. projecting population growth from life tables By assuming that R0 is constant, we are also assuming that increasing the population size is not affecting R0 so, the simple life tables used here assume that the population is Density Indep.
Here is a typical life-table problem from a past exam. B. that has no seasonality, so the birds reproduce all year round. We follow a group of eggs all laid in early March and that hatch one month later. However, 20% of the eggs get eaten by snakes before they can hatch. The peeping hatchlings attract even more snakes during April, resulting in only a 25% survival of the remaining birds. However, from May on, the birds are large enough to defend themselves and suffer no further death from snakes. In June, they pair up and make nests, producing two eggs in July and a further two eggs in August. Then they stop all reproduction, although they may live for many years. We follow a population of birds through time on a tropical island So, first, make the life table, with x, lx, bx, and lxbx
Month X px lx mx lxmx March 0 0.8 1 0 0 Apr 1 0.25 0.8 0 0 R0 = 0.4 May 2 1.0 0.2 0 0 June 3 1.0 0.2 0 0 July 4 1.0 0.2 1 0.2 Aug 5 1.0 0.2 1 0.2
X 0 1 2 3 4 5 px 0.8 0.25 1.0 1.0 1.0 1.0 lx 1 mx 0 0 0 0 1 1 lxmx 0 0 0 0 0.2 0.2 Month March Apr May June July Aug R0 = 0.4 0.8 0.2 0.2 0.2 0.2 Time/age First month 100 Second month 100 Third month 0 Fourth month 0 Fifth month 0 Six month 0 Aug. Sept. Oct Nov. Dec.
X 0 1 2 3 4 5 px 0.8 0.25 1.0 1.0 1.0 1.0 lx 1 mx 0 0 0 0 1 1 lxmx 0 0 0 0 0.2 0.2 Month March Apr May June July Aug R0 = 0.4 0.8 0.2 0.2 0.2 0.2 Time/age First month 100 0 Second month 100 80 Third month 0 ? 20 Fourth month 0 Fifth month 0 Six month 0 Aug. Sept. Oct Nov. Dec. 20 20
X 0 1 2 3 4 5 px 0.8 0.25 1.0 1.0 1.0 1.0 lx 1 mx 0 0 0 0 1 1 lxmx 0 0 0 0 0.2 0.2 Month March Apr May June July Aug Nt+1= Nt px 0.8 0.2 0.2 0.2 0.2 Time/age First month 100 0 0 0 25 Second month 100 80 0 0 0 Third month 0 25 20 0 0 Fourth month 0 0 25 20 0 Fifth month 0 0 0 25 20 Six month 0 0 0 0 25 Aug. Sept. Oct Nov. Dec.
Here is a population projection: Age time 0-0.99 1-1.99 2-2.99 3-3.99 4-4.99 total 1 0 0 100 0 0 100 2 200.00 0.00 0.00 50.00 0.00 250.0 3 250.00 100.00 0.00 0.00 0.00 350.0 4 0.00 125.00 40.00 0.00 0.00 165.0 What is the life table? Do we expect population growth? x 0 1 2 3 4 lx 1.0 mx lxmx
Here is a population projection: time 0-0.99 1-1.99 2-2.99 3-3.99 4-4.99 Age total 1 0 0 100 0 0 100 2 200.00 0.00 0.00 50.00 0.00 250.0 3 250.00 100.00 0.00 0.00 0.00 350.0 4 0.00 125.00 40.00 0.00 0.00 165.0 What is the life table? Do we expect population growth? x 0 1 2 3 4 lx 1.0 0.5 0.2 0.1 0 mx lxmx 0 0 0.4 0.5 0
Here is a population projection: time 0-0.99 1-1.99 2-2.99 3-3.99 4-4.99 Age total 1 0 0 100 0 0 100 2 200.00 0.00 0.00 50.00 0.00 250.0 3 250.00 100.00 0.00 0.00 0.00 350.0 4 0.00 125.00 40.00 0.00 0.00 165.0 What is the life table? Do we expect population growth? x 0 1 2 3 4 lx 1.0 0.5 0.2 0.1 0 mx 0 0 2 5 0 lxmx 0 0 0.4 0.5 0
II. Tools for Ecology A. Population demography: describing populations. 1. Definitions 2. Demography a. distribution, dispersion, and density b. gender and age c. population growth d. life tables (birth and death of age classes) 1) age groups - x 2) survivorship (opposite of death rate) 3) mx, average births per individual age x. 4) lxmx 5) R0 and G e. projecting population growth from life tables
X 0 1 2 3 4 5 px 0.8 0.25 1.0 1.0 1.0 1.0 lx 1 mx 0 0 0 0 1 1 lxmx 0 0 0 0 0.2 0.2 Month March Apr May June July Aug 0.8 0.2 0.2 0.2 0.2 Population projection from a life table Time/age First month 100 0 0 0 25 Second month 100 80 0 0 0 Third month 0 25 20 0 0 Fourth month 0 0 25 20 0 Fifth month 0 0 0 25 20 Six month 0 0 0 0 25 Aug. Sept. Oct Nov. Dec. Right now, we are taking columns of m s and L s from the life-table and multiplying them by rows of N s in projection matrix, yes? We are just multiplying vectors.
II. Tools for Ecology There is an easier (well, mathematically simpler) way to do population projections is using matrices. The rows and columns are just vectors. A vector is just a 1 x n arrangement of values. For example, we can construct a population vector: . . . that can be used to represent the current abundances for a population by age class. This is just like the first row of a projection matrix.
II. Tools for Ecology f. Age (Leslie) and Stage Transition Matrices A matrix is an n x m arrangement. For our use, we will use square matrices (n x n) that contain the probabilities of going from one age class to the next. This is called a Leslie matrix, after P. H. Leslie, or an age-based transition matrix. where: F0 P1 0 0 F1 0 P2 0 F2 0 0 P3 F3 0 0 0 Px = probability that an individual of age x will survive to enter the next age group x+1. M = Fx = number of female offspring born in one time interval per female age x
F3 F2 F0 F1 0 1 2 3 P3 P2 P1 where: F0 P1 0 0 F1 0 P2 0 F2 0 0 P3 F3 0 0 0 Px = probability that an individual of age x will survive to enter the next age group x+1. M = Fx = number of female offspring born in one time interval per female age (x = mxPx)
Study Guide Items from Lecture 6 Terms: Supply side population dynamics Px Stable age distribution Concepts: Testing for density dependence in an experiment How you get the stable age distribution and how it relates to R Ro only applies at the stable age distribution Projection tables from life tables, assume density independence Case Studies: Forrester s research on transparent goby, and supply side vs. density dependent population regulation.


!")