Derivative Applications for Graph Sketching
Explore how derivatives can be used to sketch functions through the first and second derivatives, identifying critical points like maxima/minima and inflection points. Learn the steps for graphing functions effectively.

Download Presentation

Please find below an Image/Link to download the presentation.
The content on the website is provided AS IS for your information and personal use only. It may not be sold, licensed, or shared on other websites without obtaining consent from the author. If you encounter any issues during the download, it is possible that the publisher has removed the file from their server.
You are allowed to download the files provided on this website for personal or commercial use, subject to the condition that they are used lawfully. All files are the property of their respective owners.
The content on the website is provided AS IS for your information and personal use only. It may not be sold, licensed, or shared on other websites without obtaining consent from the author.
E N D
Presentation Transcript
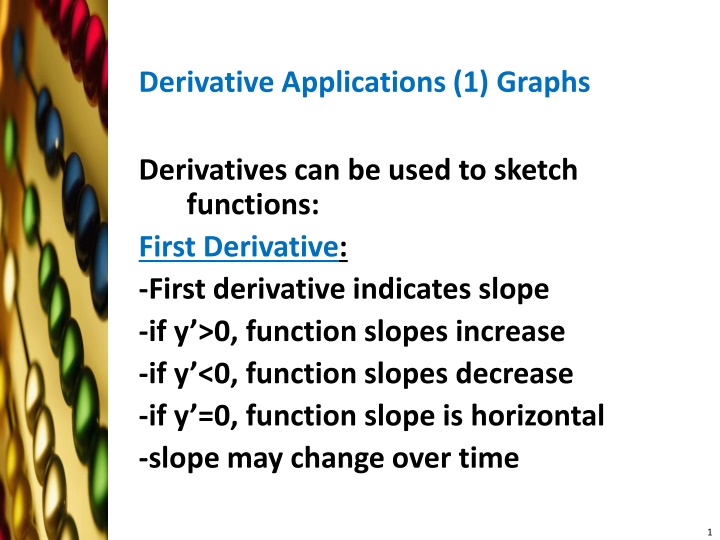
Derivative Applications (1) Graphs Derivatives can be used to sketch functions: First Derivative: -First derivative indicates slope -if y >0, function slopes increase -if y <0, function slopes decrease -if y =0, function slope is horizontal -slope may change over time 1
shape/concavity must be determined Second Derivative: -Second derivative indicates concavity -if y >0, (concave upward); (minimum point). -if y <0, (concave downward); (maximum point). -if y =0, (an inflection point occurs) 2
Sample Graphs y = 2, graph is concave upward 3
Sample Graphs y =-2, graph is concave downward 4
Critical Point An interior point of the domain of a function f where f is zero or undefined. Maxima/minima can aid in drawing graphs Maximum Point: If 1) f(a) =0, and 2) f(a) <0, - graph has a maximum point (peak) at x=a Minimum Point: If 1) f(a) =0, and 2) f(a) >0, - graph has a minimum point (valley) at x=a 5
Inflection Points: If 1) f(a) =0, and 2) the graph is not a straight line -then an inflection point occurs -(where the graph switches between concave upward and concave downward) 6
Graphing Steps: Evaluate y(x) at intersect with y-axis; (x=0). Determine where y=0 at intersect with x-axis. i) ii) iii) Calculate slope: y - and determine where it is positive and negative. Identify possible maximum and minimum co-ordinates where y =0. (Don t just find the x values). iv) 8
v) Calculate the second derivative y and use it to determine max/min in iv. vi) Using the second derivative, determine the curvature (concave upward or concave downward) at other points. vii) Check for inflection points where y =0. 9
Graphing Example 1 y=(x-5)2-3 y(0)=22, y=0 when i) ii) (x-5)2=3 (x-5) = 31/2 x = 31/2+5 x = 6.7, 3.3 (x-intercepts) iii) y =2(x-5) y >0 when x>5 y <0 when x<5 10
y=(x-5)2-3 iv) y =0 when x=5 y(5)=(5-5)2-3=-3 (5,-3) is a potential max/min. v) y =2, (5,-3) is a minimum. vi) Function is always positive, it is always concave downward. vii) y never equals zero. 11
y=(x-5)(x-5)-3 25 (0,22) 20 15 10 y 5 (3.3,0) (6.7,0) 0 1 2 3 4 5 6 7 8 9 10 -5 (5,-3) x 12
Graphing Example 2 y=(x+1)(x-3)=x2-2x-3 y(0)=-3, y=0 when iii) y =2x-2 y >0 when x>1 y <0 when x<1 i) ii) (x+1)(x-3)=0 x = 3,-1 (x-intercepts) 13
y=(x+1)(x-3)=x2-2x-3 iv) y =0 when x=1 f(1)=12-2(1)-3=-4 (1,-4) is a potential max/min. v) y =2, x=1 is a minimum. vi) Function is always positive, it is always concave upward. vii) y never equals zero. 14
y=(x+1)(x-3) 70 60 9, 60 50 8, 45 40 -5, 32 7, 32 30 -4, 21 6, 21 20 -3, 12 5, 12 10 -2, 5 4, 5 0 -1, 00, -31, -42, -33, 0 0 1 -5 -4 -3 -2 -1 2 3 4 5 6 7 8 9 -10 15
 Graphs")


 Calculate the second derivative –y’’")

2-3")
(x-5)-3")

(x-3)=x2-2x-3")
(x-3)")