Descriptive and Inferential Statistics in Clinical Research
Explore the fundamental concepts of descriptive and inferential statistics in clinical research through a didactic presentation by Dr. Peter W. Callas, focusing on data types, measures of central tendency and variability, epidemiology metrics, hypothesis testing, and more. Gain insights into statistical analysis methods for drawing meaningful conclusions from data.
Download Presentation

Please find below an Image/Link to download the presentation.
The content on the website is provided AS IS for your information and personal use only. It may not be sold, licensed, or shared on other websites without obtaining consent from the author. If you encounter any issues during the download, it is possible that the publisher has removed the file from their server.
You are allowed to download the files provided on this website for personal or commercial use, subject to the condition that they are used lawfully. All files are the property of their respective owners.
The content on the website is provided AS IS for your information and personal use only. It may not be sold, licensed, or shared on other websites without obtaining consent from the author.
E N D
Presentation Transcript
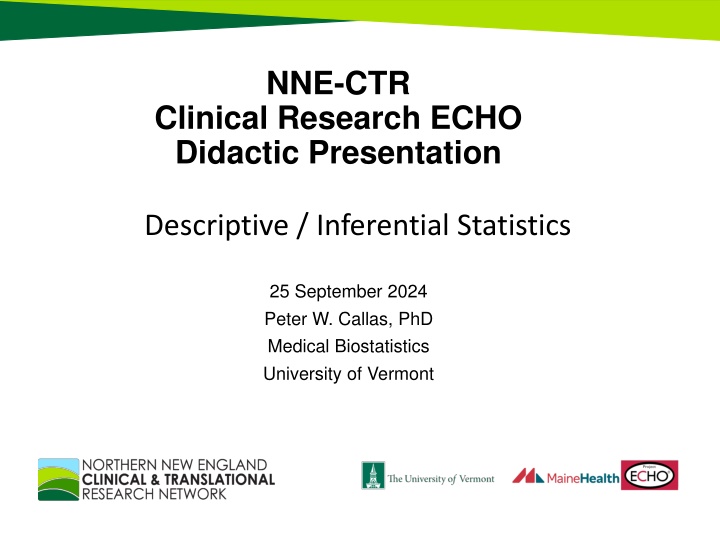
NNE-CTR Clinical Research ECHO Didactic Presentation Descriptive / Inferential Statistics 25 September 2024 Peter W. Callas, PhD Medical Biostatistics University of Vermont
Purposes of Statistics 1. Description
Of n = 122 long-term (>90 days) users, 25 (20%) reported using due to addiction to nicotine gum
Purposes of Statistics 1. Description 2. Inference
Types of Data Discrete (categorical) Dichotomous Nominal Ordinal Continuous (interval; ratio)
1. DESCRIPTION A. Measures of central tendency Mean Median Proportion
B. Measures of variability Range _ x n = i 2 ( ) x i Variance = 1 n 1 Standard deviation = ( variance ) sd Standard error = n
C. Epidemiology Measures of disease frequency Incidence Prevalence Measures of association Relative risk (RR) Odds ratio (OR) Difference measures, attributable risk
2. INFERENCE A.Hypothesis testing B. Confidence intervals
Sample vs Population x p P RR RR OR OR x1 x2 1 2
A. Hypothesis testing Some hypotheses: Ho: 1= 2 P1 = P2 RR=1 Ha: 1 2 P1 P2 RR 1
Statistical tests: Two sample t test 2 test etc
P value = probability of obtaining an estimate as least as extreme as the one obtained in this sample if Ho true ***NOT: probability that Ho true***
Two types of errors Truth Ho true Ho false Type II error Not Reject Ho Correct Type I error Reject Ho Correct = probability of type I error = probability of type II error 1- = power = probability of rejecting Ho if Ho false
B. Confidence intervals Compute estimate from sample (x, for example) Compute interval that we are pretty confident (e.g., 95%) the true value ( , for example) is in
Confidence intervals Proportion = 0.20 95% CI = 0.13-0.28 95% Confidence Interval Statisticians: On repeated sampling, 95 of 100 confidence intervals will contain the true value
Confidence intervals Proportion = 0.20 95% CI = 0.13-0.28 95% Confidence Interval Statisticians: On repeated sampling, 95 of 100 confidence intervals will contain the true value Normal people: We are 95% confident that the true population value is within this interval No one (hopefully): There is a 95% probability that the true value is within this interval
Summary of Statistical Methods Dependent variable Discrete Variable Dichotomous > 2 values Continuous I Dichotomous Chi square Chi square Two sample t test n (Logistic regression*) Nonparametric tests Fisher s exact test d Logistic regression* (t test if ordinal) Linear regression* e > 2 values Chi square Chi square ANOVA* p Series of 2x2 tables (Logistic regression*) Nonparametric tests Logistic regression* (ANOVA if ordinal) Linear regression* v Continuous Logistic regression* (ANOVA)* Linear regression* a (Two sample t test) (Logistic regression*) Correlation r * can control for one or more confounding variables ANOVA = analysis of variance or analysis of covariance ( ) = not traditional use of test Paired / repeated measures data: Paired t test, repeated-measures ANOVA, etc Time to event data: Survival analysis (Kaplan-Meier, Cox proportional hazards models, etc)

