Descriptive Statistics and Random Variables
Explore the concepts of descriptive statistics, random variables, measures of centralization and dispersion, and more with Ardavan Asef-Vaziri. Learn about numerical and categorical random variables, modes, variances, standard deviations, and coefficients of variation. Gain insights on variability in data sets and the importance of representative samples in statistical analysis.

Download Presentation

Please find below an Image/Link to download the presentation.
The content on the website is provided AS IS for your information and personal use only. It may not be sold, licensed, or shared on other websites without obtaining consent from the author. If you encounter any issues during the download, it is possible that the publisher has removed the file from their server.
You are allowed to download the files provided on this website for personal or commercial use, subject to the condition that they are used lawfully. All files are the property of their respective owners.
The content on the website is provided AS IS for your information and personal use only. It may not be sold, licensed, or shared on other websites without obtaining consent from the author.
E N D
Presentation Transcript
Descriptive Statistics Ardavan Asef-Vaziri
Random Variables- Numerical, Categorical A random Variable is an outcome of an experience! Random Variables Numerical Categorical Numerical Random Variables Height, Weight, Age Grade of a student in a course, GPA of a course The number of students attending a specific class in a specific day. Number of Roast-Beef sandwiches sold in an Arby s on Reseda in one week. Number of refrigerators sold in a day. Number of pages in a book. Number of characters in a line. Number of courses taken this semester and up-to-now. Number of students entering a campus coffee shop in a two minutes time intervals. 2 Descriptive Statistics, Ardavan Asef-Vaziri.
Random Variables- Numerical, Categorical A random Variable is an outcome of an experience! Random Variables Numerical Categorical Categorical Random Variables FIN, MKT, MGT, ACCT, SOM, etc. majors. APT., CONDO, Attached Townhome, Detached Townhome, Single Family Residence, Mobile Home, etc. A Sample is a representative of a population. Population: all incoming freshmen students in a college. Sample: a small random fraction of them that we may ask to fill a short questionnaire. Mean ( for sample, ? or sample). Average of all values. Median. At least 50% of observations are greater than or equal to median, and at least 50% of observations are less than or equal to median. 3 Descriptive Statistics, Ardavan Asef-Vaziri.
Measures of Centralization and Disperssion Mode is a number that is repeated more than any other number in the sample. Some samples do not have a unique mode. Variance is a measure of the distances between numbers in a data set. If the numbers are close to each others (and therefore are close to the average) then variance is low. Variance is the gap between each variable and the average of all variables. In order not to allow the positive and negative gaps cross each others, the differences are squared. Standard Deviation is the square root of the variance in order to return to the original dimension. Variance of a population is shown by 2. Variance of a sample is shown by s2. Variance of a population: ??= (? ?)?/N, where N are is the size of the population. Variance of a sample: ??= (? ?)?/(n 1), where n is the size of the sample. 4 Descriptive Statistics, Ardavan Asef-Vaziri.
Measures of Dispersion- Variability When we estimate one parameter and use it in estimating a second parameter, we lose one degree of freedom in the second parameter. That is why instead of n we have n-1. Why? because to estimate s2 (the variance of the sample), we need to first estimate ? (the average of the sample) and then find the gaps. Which one of these variables show more variability? A variable with standard deviation of 10, or variable with standard deviation of 100, or variable with standard deviation of 1000? We do not know. A Standard Deviation of 10 related to an average of 10 shows more variability compared to a standard deviation of 1000 in relation to an average of 100000. Coefficient of Variations is standard deviation divided by average. CV= s/ ? or CV= / We may also compute rations such as Range to Median or Average to Variance . 5 Descriptive Statistics, Ardavan Asef-Vaziri.
Excel Page- Lecture Only the First 6:35 mins Variance = VAR = [SUM(X-Xbar)^2]/(n-1) Count=N= 18 SUM 1272 Average= 70.667 Average= 70.667 SUM(X-Xbar)2= 1878 VAR= SUM(X-Xbar)2/(n-1)= 110.5 StdDev 10.510 StdDev 10.510 CV 0.149 Mean/Variance 0.640 Median 68 Max 88 Min 52 Range 36 Range/Median 0.529411765 (X-Xbar)2 106.78 205.44 7.11 44.44 7.11 160.44 44.44 18.78 128.44 93.44 69.44 21.78 348.44 300.44 136.11 7.11 0.44 177.78 RAND 84 82 86 84 61 59 65 80 79 68 87 62 61 58 65 69 80 85 X 81 85 68 64 68 58 64 75 82 61 79 66 52 88 59 68 70 84 X-Xbar 10.33 14.33 -2.67 -6.67 -2.67 -12.67 -6.67 4.33 11.33 -9.67 8.33 -4.67 -18.67 17.33 -11.67 -2.67 -0.67 13.33 =COUNT(B2:B19) =SUM(B2:B19) =G3/G2 =AVERAGE(B2:B19) =SUM(D2:D19) =G6/(G2-1) =SQRT(G7) =STDEV.S(B2:B19) =G8/G4 =G4/G7 =MEDIAN(B2:B19) =MAX(B2:B19) =MIN(B2:B19) =G13-G14 =G15/G12 The lecture is recorded at https://youtu.be/yIiBczkEBR0 Watch up to minute 6:35 If there are more than one Tab in an Excel File, only loop into the Yellow Tabs. When there are RAND data, you can always create more examples by replacing the fixed data by random data Confidence level 0.95 Alpha 0.05 Margin of Error 4.855513565 UCL 75.52218023 LCL 65.8111531 Confidence Interval 65.81 - 75.52 =CONFIDENCE.NORM(G25,G8,G2) =$G$4+G26 =$G$4-G26 =ROUND(G28,2)&" - "&ROUND(G27,2) 6 Descriptive Statistics, Ardavan Asef-Vaziri.
Descriptive Statistics: Data Analysis vs Excel Functions-15 mins This Lecture is recorded at https://youtu.be/DRFxdMLvFdA Fixed 1490 1880 1180 1420 1800 Rand 1350 1250 1210 1240 1010 Rand 1630 1240 1440 1920 1470 Rand 1860 1410 1410 1320 1350 Rand 1750 1340 1920 1440 1380 Rand 1860 1550 1620 1310 1860 Rand 1530 1230 1270 1560 1150 Rand 1590 1440 1390 1350 1200 Rand 1670 1820 1120 1710 1510 Rand 1180 1590 1980 1860 1200 Rand 1850 1760 1680 1500 1410 1 2 3 69 70 Mean Median Mode Standard Deviation Minimum Maximum Range Count Standard Error CV R/Med 1507.14 1490.00 1490.00 277.02 1070.00 2000.00 930.00 70.00 33.11 0.18381 0.62416 1464.00 1475.00 1350.00 294.98 1000.00 1990.00 990.00 70.00 35.26 0.20149 0.67119 1502.14 1505.00 1440.00 291.30 1000.00 1980.00 980.00 70.00 34.82 0.19393 0.65116 1479.00 1410.00 1320.00 303.58 1020.00 1990.00 970.00 70.00 36.28 0.20526 0.68794 1528.14 1545.00 1640.00 289.40 1000.00 2000.00 1000.00 70.00 34.59 0.18938 0.64725 1488.86 1515.00 1860.00 282.89 1020.00 2000.00 980.00 70.00 33.81 0.19001 0.64686 1566.29 1545.00 1870.00 273.98 1040.00 1980.00 940.00 70.00 32.75 0.17493 0.60841 1447.57 1405.00 1680.00 274.97 1010.00 1960.00 950.00 70.00 32.86 0.18995 0.67616 1474.86 1450.00 1670.00 275.66 1000.00 2000.00 1000.00 70.00 32.95 0.18691 0.68966 1443.71 1395.00 1310.00 281.42 1000.00 1990.00 990.00 70.00 33.64 0.19493 0.70968 1534.14 38.0043 =AVERAGE(L$4:L$73) 1560.00 =MEDIAN(L$4:L$73) 1740.00 =MODE(L$4:L$73) 298.47 =STDEV.S(L$4:L$73) 1000.00 =MIN(L$4:L$73) 2000.00 =MAX(L$4:L$73) 1000.00 =L81-L80 70.00 =COUNT(L$4:L$73) 35.67 =L79/SQRT(L83) 0.19455 =L79/L76 0.64103 =L82/L77 7 Descriptive Statistics, Ardavan Asef-Vaziri.
Average & Standard Deviation of Group of Data. 10 mins. Observations Probability The lecture is recorded at https://youtu.be/yIiBczkEBR0 Watch from 6:35 to the end. About 10 mins. (x-xbar)2 [(x-xbar)2]f(x) F(x) f(x) xf(x) 10 0.05 0 9.61 0.4805 0.05 20 0.1 0.1 4.41 0.441 0.15 30 50 60 30 0.15 0.25 0.3 0.15 0.3 0.75 1.2 0.75 3.1 1.21 0.01 0.81 3.61 0.1815 0.0025 0.243 0.5415 1.89 1.374772708 0.443475067 0.3 0.55 0.85 1 Variance ( 2) 200 Mean (m m) 1 Standard Deviation ( ) CV Range ? 3.1 =SUMPRODUCT(A3:A8,C3:C8) 1.89 =SUMPRODUCT(C3:C8,E3:E8) 1.375 =SQRT(B15) 0.443 =B16/B14 8 Descriptive Statistics, Ardavan Asef-Vaziri.
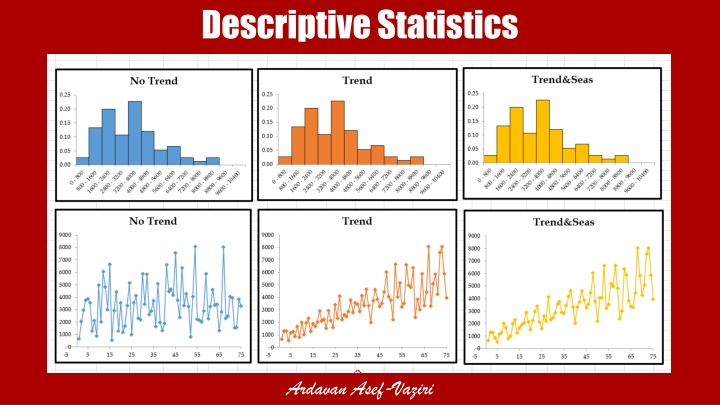
From Descriptive Statistics to Time Series Per. No Trend Trend Trend&Seas 1 8572 731 731 2 3278 1108 1108 3 1382 757 1721 4 4696 1721 1210 5 5047 1544 757 6 2198 1802 1544 7 1445 1210 1802 8 4947 1445 1860 9 1544 1269 1445 10 3532 1382 1269 11 3748 2423 1382 12 1108 1860 2423 13 2295 3202 3202 Statistics Set 1 Set 2 Set 3 Mean Median Max Min Range StdDev CV Mean/Median Range/Mean 4028.7733 4028.7733 4028.7733 3570 3570 3570 8627.0000 731.0000 7896.0000 2127.1563 0.5280 1.128508 1.9599 8627.0000 731.0000 7896.0000 2127.1563 0.5280 1.128508 1.9599 8627.0000 731.0000 7896.0000 2127.1563 0.5280 1.128508 1.9599 Mode Mode Single #N/A #N/A #N/A #N/A #N/A #N/A Mode Multiple #N/A #N/A #N/A 9 Descriptive Statistics, Ardavan Asef-Vaziri.


