Descriptive Statistics and Significance Testing in Quantitative Papers
Enhance your ability to read and interpret tables presenting descriptive statistics and significance testing results in quantitative research papers. Explore the impact of group dance exercise intervention on care workers' job intentions through detailed participant characteristics analysis. Learn why descriptive statistics are crucial for uncovering trends and patterns in data.
Download Presentation

Please find below an Image/Link to download the presentation.
The content on the website is provided AS IS for your information and personal use only. It may not be sold, licensed, or shared on other websites without obtaining consent from the author. If you encounter any issues during the download, it is possible that the publisher has removed the file from their server.
You are allowed to download the files provided on this website for personal or commercial use, subject to the condition that they are used lawfully. All files are the property of their respective owners.
The content on the website is provided AS IS for your information and personal use only. It may not be sold, licensed, or shared on other websites without obtaining consent from the author.
E N D
Presentation Transcript
Descriptive statistics and tests of significance Reading tables in quantitative papers Part of resource: https://www.ncrm.ac.uk/resources/online/all/?id=20846 Dr Chiara Dall Ora
At the end of this resource you will be able to Read tables reporting descriptive statistics Read tables reporting significance testing Interpret results from tables
Descriptive statistics in a quantitative paper why? Sort and summarise data Data have a story to tell don t jump ahead to the end! Descriptive data enable us to spot trends and patterns
An example Research Question: What is the effect of a group dance exercise intervention on care workers intention to leave their jobs? Participant characteristics Intervention group (n = 73) Control group (n= 71) Age. Mean (SD) 29.7 (11.1) 36.8 (9.2) Gender. n (%) Female Male 46 (63.1%) 27 (36.9%) 39 (54.9 %) 32 (45.1%) Years in profession 0-2 >2-5 >5-10 >10 11 (15.1%) 23 (31.5%) 5 (6.8%) 34 (46.6%) 14 (19.7%) 21 (29.5%) 8 (11.3%) 28 (39.5%)
Research Question: What is the effect of a group dance exercise intervention on care workers intention to leave their jobs? Participant characteristics Intervention group (n = 73) Control group (n= 71) Age. Mean (SD) 29.7 (11.1) 36.8 (9.2) Gender. n (%) Female Male 46 (63.1%) 27 (36.9%) 39 (54.9 %) 32 (45.1%) Years in profession 0-2 >2-5 >5-10 >10 11 (15.1%) 23 (31.5%) 5 (6.8%) 34 (46.6%) 14 (19.7%) 21 (29.5%) 8 (11.3%) 28 (39.5%)
Research Question: What is the effect of a group dance exercise intervention on care workers intention to leave their jobs? Participant characteristics Intervention group (n = 73) Control group (n= 71) Age. Mean (SD) 29.7 (11.1) 36.8 (9.2) Gender. n (%) Female Male 46 (63.1%) 27 (36.9%) 39 (54.9 %) 32 (45.1%) Years in profession 0-2 >2-5 >5-10 >10 11 (15.1%) 23 (31.5%) 5 (6.8%) 34 (46.6%) 14 (19.7%) 21 (29.5%) 8 (11.3%) 28 (39.5%)
Research Question: What is the effect of a group dance exercise intervention on care workers intention to leave their jobs? Participant characteristics Intervention group (n = 73) Control group (n= 71) Age. Mean (SD) 29.7 (11.1) 36.8 (9.2) Gender. n (%) Female Male 46 (63.1%) 27 (36.9%) 39 (54.9 %) 32 (45.1%) Years in profession 0-2 >2-5 >5-10 >10 11 (15.1%) 23 (31.5%) 5 (6.8%) 34 (46.6%) 14 (19.7%) 21 (29.5%) 8 (11.3%) 28 (39.5%)
Take home messages descriptive statistics Consider the implications of summarising variables differently e.g. mean, median, mode or in categories Check your assumptions about data distributions in the literature Remember in RCTs if sampling and randomisation have been conducted correctly, any differences between groups are due to chance Investigate whether authors have considered stratified sampling
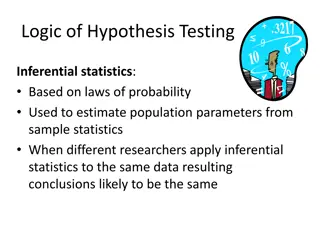
Significance testing in quantitative papers These tests are useful to assess whether there are statistically significant differences between groups Researchers often report them to check differences between intervention and control group
An example null hypothesis: age is equal between intervention and control group t-value p-value 4.1729 .0001
An example null hypothesis: age is equal between the intervention and control group populations t-value p-value 4.1729 .0001 The p-value is the frequency probability of the distribution meeting the null hypothesis
An example null hypothesis: gender in the is equal between the intervention and control group populations 2 p-value 0.9726 .324
Take home messages significance testing In a well-conducted RCT we should not worry about baseline variables differences between intervention and control group Significance testing in these instances is not meaningful or useful, but many authors still report them Significant difference does not equal association/correlation/effect


