Design & Technology GCSE Assessment Objectives
This content introduces the assessment objectives for the Eduqas GCSE Design & Technology exam. It outlines the key areas of focus such as identifying design possibilities, creating prototypes, analyzing outcomes, and applying technical principles. The overall structure, technical principles, mathematics requirements, and design principles are also covered.

Download Presentation

Please find below an Image/Link to download the presentation.
The content on the website is provided AS IS for your information and personal use only. It may not be sold, licensed, or shared on other websites without obtaining consent from the author. If you encounter any issues during the download, it is possible that the publisher has removed the file from their server.
You are allowed to download the files provided on this website for personal or commercial use, subject to the condition that they are used lawfully. All files are the property of their respective owners.
The content on the website is provided AS IS for your information and personal use only. It may not be sold, licensed, or shared on other websites without obtaining consent from the author.
E N D
Presentation Transcript
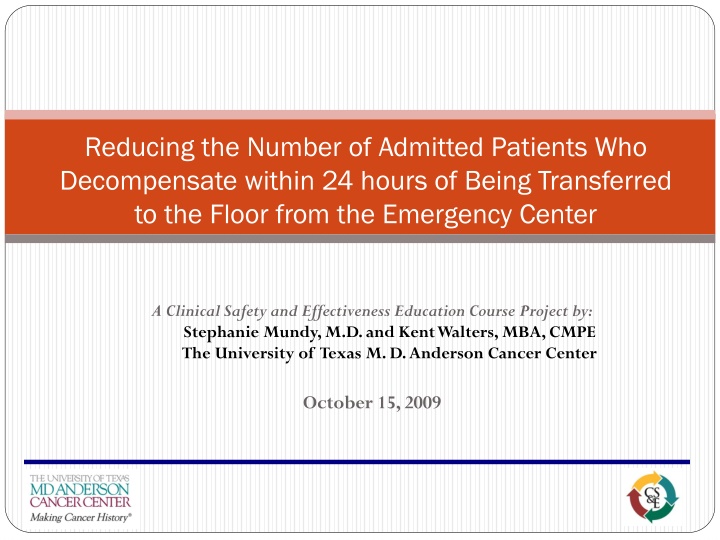
Reducing the Number of Admitted Patients Who Decompensate within 24 hours of Being Transferred to the Floor from the Emergency Center A Clinical Safety and Effectiveness Education Course Project by: Stephanie Mundy, M.D. and Kent Walters, MBA, CMPE The University of Texas M. D. Anderson Cancer Center October 15, 2009
Rationale Resource Utilization, Improve Patient Care There is a need to improve how patient acuity is assessed in order to optimize our patient care resources To improve patient care by reducing number of patients who decompensate and are transferred to ICU within 24 hours of admission to floor from the Emergency Center Decompensate = patient had cardiopulmonary arrest or severe decline in physical status requiring emergent attention of the medical staff To optimize utilization of nursing unit, telemetry, and ICU beds through improved assessment of patient acuity prior to transfer from the Emergency Center Based on limited bed resources (physical space and staffing) for all units identified above 2
Rationale Problem Confirmation During the period January 2006 through mid-November 2006 there were 94 patients who transferred from the floor to the ICU in less than 24 hours from admission from the Emergency Center or 1.45% of total admissions from the Emergency Center All patients transferred to the ICU were included, consisting of postoperative patients, patients transferred for a procedure or careful monitoring as well as those truly decompensated 3
Rationale Research Nearly 85% of inpatients that had cardiac arrest showed identifiable signs of deterioration during the previous eight hours. Recognition of these signs and timely intervention may reduce morbidity and mortality . Source: Bristow PJ, Hillman KM, Chey T, Daffurn K, Jacques TC, Norman SL, Bishop GF, Simmons EG: Rates of in-hospital arrests, deaths and intensive care admissions: The Effects of a Medical Emergency Team, MJA 2000;173:236-240. 4
Background The Emergency Center admits 35% of all hospital admissions at UTMDACC, which approximates 656 patients per month Emergency Center patient acuity is significantly higher than a non-cancer specific emergency center: Facility UT M. D. Anderson Cancer Center Non-cancer Hospital % of Patients Admitted from EC 35.0% 13.9% % of Admissions to ICU 7.0% 1.3% (1) (1) Source: National Ambulatory Care Survey: 2003 Emergency Department Summary. Advance Data. Number 358. May 26, 2005. U.S. Department of Health and Human Services, CDC. 5
Background Project is first step in developing acute care scoring system for all patients EC selected as pilot area given 35% of inpatient admissions originate from the EC; and EC inpatient admissions represent a higher acuity patient population with a greater chance of decompensating within 24 hours of being admitted to the floor. 6
Aim Statement Decrease by 25%, the decompensation rate (transfers to the ICU within 24h) for patients admitted to the floor from the Emergency Center, within 12 months. 7
Multidisciplinary Team Approach Physician Nursing Quality Improvement Aim Statement Reducing the Number of Admitted Patients Who Decompensate within 24 hours of Being Transferred to the Floor from the EC Pharmacy Business Administration Information Systems Clinical Informatics
Ishikawa Analysis Ishikawa analyzed for commonality in process areas to determine an area of concern as viewed by all health care providers that contribute to patient decompensating Ishikawa processes were identified by physician, nursing, clerical, pharmacy, and business staff members through distribution of cause and effect diagram and focus groups Each process then ranked (1 to 5, high to low) by each individual relative to chief concerns 9
Ishikawa (Fishbone) Diagram Contributing Factors Communication Patient factors Difficult no consistent path to communicate with Admitting team Cancer Pts very complex + comorbidities No Handoff to fellows who cover after clinic hours & on weekends? Neutropenic Fever No common language between care givers to communicate pt acuity EC MD to EC MD report simply admitted no status report Vital signs questionable HR 130, Sys < 90 Sicker Pt results in higher % admitted No consistent process/criteria for EC RN to report admitted pt changes to EC MD EC MD to adm MD short, limited verbal handoff Page operators unaware of updated call schedule Pager problems - Rolling over New EC patient vs Admitted EC patient needs Requires > 40 % O2 to keep O2 sat. > 90% Bilateral pneumonia Floor RN difficulty which MD to call for orders Admitted EC patient needs admitting orders RN -> RN handoff How do they Prioritize? Patient & family satisfaction / dissatisfaction w/process Admitted EC patient needs consultant but may not come until after primary team has visited Patient admitted through EC who decompensates on floor & moved to ICU within 24 hours EC RN to patient ratio 1 - 4 Priority to new EC Pt EC team often desensitized to how sick the Pts may be EC frequently busy RN cares for sickest first - Prioritize care for all patients EC Record not always available to floor Admitting team challenge - transfer of care occurred even if pt still physically in EC EC MD write Admission orders for non-surgical pts ICU/sickest patients require more resources Delays in getting tests when busy Delay in writing Admission orders when EC busy Limited # EC MD s One EC MD from 1:00 am to 9:30 am Waiting for ICU/tele/floor Process to get in ICU beds to be available Care Delayed - Consults do not come until primary MD sees pt. Pts often not seen by Primary w/ in 24 hours Variation of skill levels of Healthcare providers Initiating Admission Orders in EC - process & timing varies Frequency of V / S in EC Criteria for notification vital sign changes Primary attending full house + rounds clinic by 1300 ER / Enviornment Methods Staffing 10
Ishikawa Analysis 80 76 72 70 60 50 Total Points 39 37 40 35 30 20 10 0 Waiting for ICU/tele/floor beds to be available Cancer pts very complex + comorbidities Vital signs questionable Pts often not seen by primary w/in 24 hours Requires >40% O2 to keep O2 sat >90% 11
Ishikawa Analysis Sorted Histogram of Top Reasons for Patients Decompensating within 24 hours of Admission to Floor from the EC 80 120% 76 74 72 70 100% 100% 60 Cumulative Percentage 86% 80% 50 Total Points 40 60% 37 58% 30 40% 20 29% 20% 10 0 0% Waiting for ICU/tele/floor beds to be available Vital signs questionable e.g. sat level>02 required Cancer pts very complex + comorbidities Pts often not seen by primary w/in 24 hours Reason for Patient Decompensating 12
What We Uncovered Waste in how vital signs are documented Handwritten on EC note Entered into ClinicStation Entered into Whiteboard Likely need for improved ICU bed resource and utilization Improved training needed on vital sign monitoring Root cause analysis of why certain units have higher decompensation rate than others Pandora by John William Waterhouse, 1896 13 13
Intervention Options The cause and effect analysis resulted in intervention options: All patients reevaluated by MD prior to transfer All patients reevaluated by RN prior to transfer Complex scoring system utilizing vital signs, comorbidities, type of cancer, labs etc. too time consuming ClinicStation be modified to signal (red flashing) when vital signs trends are abnormal not feasible at current time Vital signs to be taken every 2 hours with split of CNA every 4 hours and RN every 4 hours and placed into ClinicStation creative staffing solution! Vital signs linked from bedside monitor to ClinicStation technically possible financially not 14
Selected Intervention Criteria for selection was ease of implementation (people, process, and technology) relative to direct and indirect costs Based on criteria and testing of options it was discovered ClinicStation could print a vital sign trend in graph and table format 15
Intervention Implementation Current Process Mapping Process Variations Manual Process Most take all of the patients vitals and write them on the old vital sign board, then enter the data into CS. Logs into Clinic Station: ID, Password (if the CNA is registry, one of our USC s log them into C.S.) Type in the MR# of the pt you wish to take vital signs, hit enter Pt data screen opens. Scroll down to NSG DOCUMENTATION, click the mouse. A few take the computer door to door and enter the data into CS immediately after the VS are taken. Moving from room to room w/ the computer is faster. New screen opens w/ list of EC pts. Click on the name of pt again, in the new screen. This opens the C.S. vital sign sheet (SEE example page w/ #2 at the top) Enter the information into the boxes Click save and complete. Click close (same screen) Screen returns to the list of EC pts. Take the vital signs Start New Patient 16
Intervention Implementation 10/14/2009 Clinical Safety and Effectiveness Project Reducing the Number of Admitted Patients Who Decompensate within 24 hours of Being Transferred to the Floor from the EC EC Physician Patient Checkout Process Flow Chart Key Patient Status Indicators: 1. Patient is DNR 2. Patient is borderline or unstable 3. Patient is neutropenic ER Physician Check-out Process (patient is ready to leave EC) EC Physician EC Physician prints out vital sign trend graph in Clinic Station and reviews trend. Place graph on top of chart. Component Process If Patient is admitted but remains in EC greater than 2 hours post discharge i.e. waiting for bed EC Physician Graph is stamped by EC Physician using his/her own stamp Patient is ready to be transferred from EC to room EC Physician EC Physician writes next to stamped signature: OK for Discharge, OK for Transfer to Floor, etc. Stamp updated graph and write: OK for level of care or no significant change Staple updated trend to EC physician trend graph in box on either POD A or B Nursing Staff Print out updated graph and review for abnormal trend No Yes Abnormal Trend Nursing Staff Removes vital sign trend graph (with MD stamp) and place it in box in Pod A or B Nursing Staff Legend Inform appropriate physician of trend Symbol Count Description 1 1 1 1 8 Main process Event Component Process path Function Physician and/or Nursing Staff document intervention results on trend graph 17
Intervention Implementation 1/6/2007 Clinical Safety and Effectiveness Project Reducing number of patients who decompensate within 24 hours of admission to floor/unit EC Patient Vital Sign Process Flow Chart Routine patient vital signs recorded into ClinicStation every 2 hours MD Arrives at patient room Nursing Staff (RN) record vital signs at: 2a 6a 10a 2p 6p 10p CNA record vital signs at: 12a 4a 8a 12p 4p 8p MD conducts medical evaluation and reviews vital sign trend chart Abnormal vital sign(s) noted Medical decision- making by MD NO No Yes Yes CNA informs RN of abnormal vital sign(s) RN rechecks vitals and checks trend chart MD documents orders in ClinicStation Abnormal vital sign(s) verified RN reviews and initiates MD orders Yellow flag moved flush to wall. END OF PROCESS Start at Beginning until patient discharged from EC YES RN leaves room and continues normal work process RN notifies MD via Vocera RN moves yellow flag to out position Legend Description Symbol MD receives Vocera and responds with confirmation ETA to evaluate patient Main process Event Function Warning 18
Intervention Implementation Intervention implementation required using the Plan Do Check Act (PDCA) methodology A process diagram was developed based on the perceived new work flow for reviewing vital sign trends Process flow charts posted in the EC and distributed to EC physicians, RNs, and CNA Follow-up written and verbal communication occurred 19
Selected Intervention 2 keystrokes total review and print. Meets process and technology objectives. Table Format Graph Format Vital Sign Review in action 20
Data Collection Data was collected at 3 points Initial period of 11/17/06 to 11/30/06 and 12/1/06 to 12/31/06, and 01/1/06 to 04/30/09 First data collection period saw no change in percent of patients who decompensate Though analysis determined sample too small to draw any conclusions as to effectiveness of intervention 21
Baseline Data Percent of EC Admissions - 'EC-Floor-ICU within 24 Hours' Baseline VS EC P 5 11 month decompensation rate = 1.45% # EC-Fl-ICU w/in 24 hr pts/ # EC adm pts 4 UCL=3.18 3 CL=2.30 1 0 Jan 06 Mar 06 May 06 Jul 06 Sep 06 NovA 06 Feb 06 Apr 06 Jun 06 Aug 06 Oct 06 NovB 06 22
Data Collection 2nd Point Percent of EC Admissions - 'EC-Floor-ICU within 24 Hours' Baseline VS EC Project 5 Intervention 11/17/06 # EC-Fl-ICU w/in 24 hr pts/ # EC adm pts 4 UCL=3.16 2.28% to 1.89% decompensation rate 3 CL=2.10 1 LCL=1.04 0 Jan 06 Mar 06 May 06 Jul 06 Sep 06 NovA 06 Dec 06 Feb 06 Apr 06 Jun 06 Aug 06 Oct 06 NovB 06 23
Data Collection Data Collection Comparison by Baseline, New Comparison by Baseline, New EC, and EC Pod A EC, and EC Pod A New average of 0.7% for a 47.5% change since project inception 24
Intervention Results Solid improvement achieved during second data collection period compared to first data collection period During the project period there was 33% compliance with the vital sign summary analysis, and only 33% of those patients transferred to the ICU during both periods had the vital sign data complete with indication of review Important to note data was more inclusive than exclusive during first round of baseline data collection 25
Obstacles Encountered Throughout the intervention process several obstacles encountered: Compliance with printing and signing vital sign trend graph High EC volume that contributed to reduced compliance on certain days Inconsistency in using ClinicStation for vital sign entry Competing CS&E projects as well as other quality improvement initiatives information overload e.g. remembering what to do when and for whom 27
Obstacles - Communication We said CS&E project; improve patient care; simple form; how exciting! They heard another piece of paper; CS what?; and I should be concerned about this because 28
Obstacles Encountered Compliance Rate 90% Average 6 week compliance rate = 33% 80% 78% 70% 61% 60% 49% 53% 49% 49% 50% 48% 48% 46% 45% 43% 43% 39% 40% 38% Compliance Percent 37% 37% 36% 35% 35% 33% 32% 32% 31% 30% 30% 26% 26% 29% 30% 27%28% 26% 25% 24% 23% 23% 23%22% 20% 20% 20% 18% 17% 16% 16% 10% 10% 1% 0% 29
How Obstacles Were Addressed Communicate, Communicate, Communicate! Constant communication (direct and indirect) increased compliance rates significantly Compliance rate improved when Dr. Mundy was working in the EC! 30
ROI Analysis Cost Basis Average Cost per Day (H&C Only) and ALOS for Intensive Care Units January 2008 - December 2008 Admissions Medical ICU ALOS* Medical ICU Avg Charge/Day Medical ICU Avg Cost/Day 5.91 $ 15,081 $ 7,267 Pedi ICU ALOS* Pedi ICU Avg Charge/Day Pedi ICU Avg Cost/Day 4.92 $ 16,284 $ 7,877 Overall ICU Avg Cost Day $ 8,224 31
ROI Analysis ROI Analysis Cost Avoidance Cost Avoidance The project has significant impact on cost avoidance. Avoided costs included ICU charges not reimbursed due to payor (especially governmental). In a DRG environment, this is key and critical. The average ICU admission charge (bed, drugs, therapies, imaging) can average ~ $15,081 per day. The average ICU cost per day is $7,267. Reducing ICU bed days (especially in a DRG environment) by 47% results in an annual savings of ~$ 4,360,200.00(600 ICU bed days avoided multiplied by $7,267). 32
ROI Analysis Changes to Whiteboard and ClinicStation Process of charting vitals directly into ClinicStation eliminates need for paper based progress notes. Productivity gains based on time involved in using paper based systems and then re- transcribing into ClinicStation. Other Benefits Improved patient safety by reducing transposition errors Increased nursing time with patient instead of paperwork Compliance in entering vitals into ClinicStation Decrease in patient to physician time, and Significant morale booster! 33
Overall Conclusions Sustainability Monthly review of patient decompensating data to be presented by 3rd Thursday of month at EC Management meeting Improvements to be made include adding time reviewed with signature on medical record form (time stamp in ClinicStation now eliminates this step) Institutional Learning Improved understanding of how clinical processes should leverage technology to improve patient safety and maintain true patient centered care. 34
UT System and UT System and UT M. D. Anderson Cancer Center UT M. D. Anderson Cancer Center Executive Leadership for the Executive Leadership for the opportunity opportunity 35


 Diagram")