Determination of Water Resource Classes and Quality Objectives in Mzimvubu Catchment
Explore the final ranking of scenarios and recommendations in the presentation on determining water resource classes and quality objectives for the water resources in the Mzimvubu catchment. The project plan involves steps like stakeholder engagement, quantifying resource availability, and identifying scenarios within Integrated Water Resource Management. Sensitivity analysis and ranking methods provide valuable insights for decision-making.

Download Presentation

Please find below an Image/Link to download the presentation.
The content on the website is provided AS IS for your information and personal use only. It may not be sold, licensed, or shared on other websites without obtaining consent from the author. If you encounter any issues during the download, it is possible that the publisher has removed the file from their server.
You are allowed to download the files provided on this website for personal or commercial use, subject to the condition that they are used lawfully. All files are the property of their respective owners.
The content on the website is provided AS IS for your information and personal use only. It may not be sold, licensed, or shared on other websites without obtaining consent from the author.
E N D
Presentation Transcript
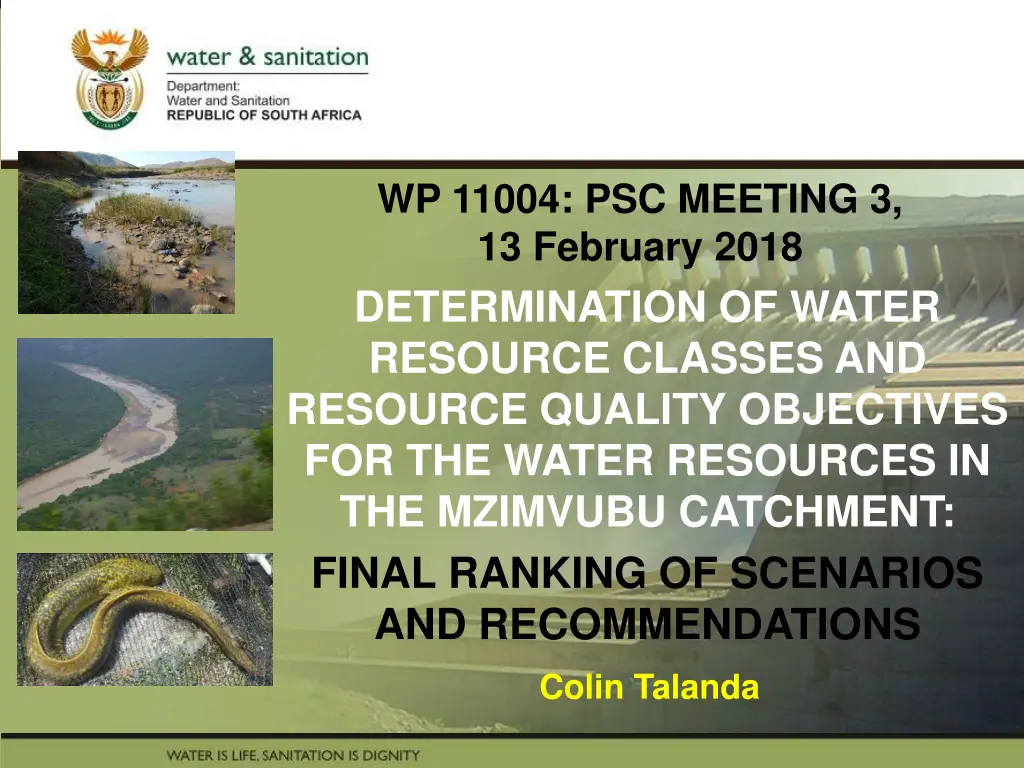
WP 11004: PSC MEETING 3, 13 February 2018 PRESENTATION TITLE DETERMINATION OF WATER RESOURCE CLASSES AND RESOURCE QUALITY OBJECTIVES FOR THE WATER RESOURCES IN THE MZIMVUBU CATCHMENT: FINAL RANKING OF SCENARIOS AND RECOMMENDATIONS Presented by: Name Surname Directorate Date Colin Talanda
PROJECT PLAN Step 1: Delineate and prioritise RUs and select study sites Step 2: Describe status quo and delineate the study area into IUAs STAKEHOLDER ENGAGEMENT Step 3: Quantify BHNR and EWR Step 4: Identify and evaluate scenarios within IWRM Step 5: Determine Water Resource Classes based on catchment configurations for the identified scenarios Step 6: Determine RQOs (narrative and numerical limits) and provide implementation information Step 7: Gazette Water Resource Classes and RQOs
VISUALISATION OF VARIABLE SCORES Ecological Status relative to REC Economic Indicator Ecosystem Services Employment S61 S2c S63 S54 S69 S65 S69 S70 S53 S53 S2b S70 S62 S54 S62 S63 S2c S2b S61 S65 1.0 2.0 3.0 1.0 2.0 3.0 1.0 2.0 3.0 1.0 2.0 3.0 1 2 3 4 5 0.5 0.05 0.2 0.25
OVERALL RANKING (TWO RANK METHODS) Normalised Ranking Method Rank Order Ranking Method
SENSITIVITY ANALYSIS AND SYNTHESIS OF RESULTS Rank Position of Scenario (Normalisation Ranking Method) Alternative EcologyEcoSystem Services S2b S53 1 0.50 0.05 0.20 0.25 10.0 3.0 2 0.50 0.10 0.20 0.20 10.0 3.0 3 0.50 0.15 0.15 0.20 10.0 3.0 4 0.50 0.05 0.15 0.30 10.0 3.0 5 0.50 0.05 0.30 0.15 10.0 3.0 6 0.25 0.25 0.25 0.25 10.0 6.0 7 0.20 0.10 0.40 0.30 8.0 6.0 8 0.15 0.10 0.45 0.30 8.0 6.0 9 0.50 0.05 0.20 0.25 10.0 3.0 10 0.40 0.20 0.10 0.25 10.0 5.0 11 0.30 0.30 0.15 0.25 10.0 5.0 12 0.30 0.20 0.25 0.25 10.0 6.0 Weights GDP Jobs S54 S61 S62 S63 S65 S69 S2c S70 1.0 2.0 8.0 9.0 5.0 7.0 6.0 4.0 1.0 2.0 9.0 8.0 5.0 6.0 7.0 4.0 1.0 2.0 9.0 7.0 6.0 5.0 8.0 4.0 1.0 2.0 8.0 9.0 5.0 7.0 6.0 4.0 1.0 2.0 8.0 9.0 5.0 7.0 6.0 4.0 1.0 3.0 4.0 8.0 2.0 9.0 7.0 5.0 1.0 7.0 2.0 9.0 10.0 4.0 3.0 5.0 1.0 7.0 2.0 9.0 10.0 4.0 3.0 5.0 1.0 2.0 8.0 9.0 5.0 7.0 6.0 4.0 1.0 2.0 8.0 7.0 3.0 6.0 9.0 4.0 1.0 3.0 6.0 8.0 2.0 7.0 9.0 4.0 1.0 3.0 5.0 8.0 2.0 9.0 7.0 4.0 Rank: 1 = best, 4 = worse.