Determining Water Resource Classes in Mzimvubu Catchment
This presentation focuses on the determination of water resource classes and quality in the Mzimvubu Catchment. It covers background information, creating a representative network, using penalties to define operating rules, and the overall objectives of optimizing water resource utilization while minimizing operational costs. The process involves prioritizing supply to water users, selecting operating rules, implementing and evaluating them, and repeating the selection process as needed. The creation of a representative network model involves identifying main physical features and using symbols to represent different elements. The resulting network model includes urban, recreation, ecology, irrigation, and industrial components.

Download Presentation

Please find below an Image/Link to download the presentation.
The content on the website is provided AS IS for your information and personal use only. It may not be sold, licensed, or shared on other websites without obtaining consent from the author.If you encounter any issues during the download, it is possible that the publisher has removed the file from their server.
You are allowed to download the files provided on this website for personal or commercial use, subject to the condition that they are used lawfully. All files are the property of their respective owners.
The content on the website is provided AS IS for your information and personal use only. It may not be sold, licensed, or shared on other websites without obtaining consent from the author.
E N D
Presentation Transcript
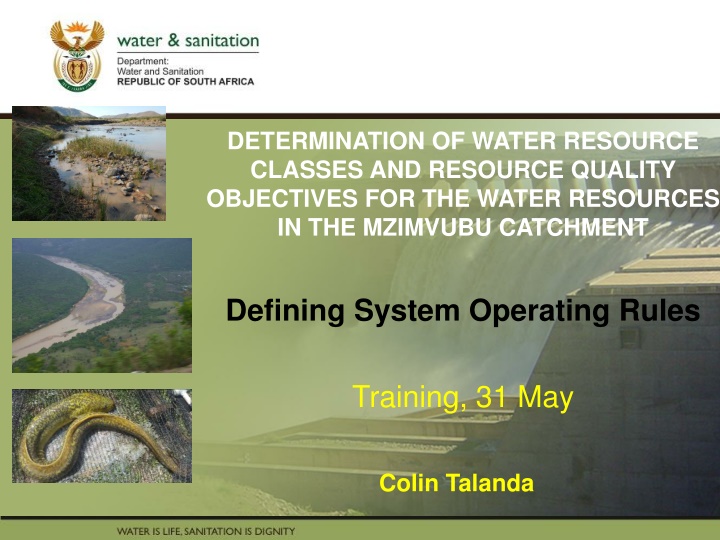
DETERMINATION OF WATER RESOURCE CLASSES AND RESOURCE QUALITY PRESENTATION TITLE OBJECTIVES FOR THE WATER RESOURCES IN THE MZIMVUBU CATCHMENT Presented by: Name Surname Directorate Defining System Operating Rules Date Training, 31 May Colin Talanda
Contents 1. Background 2. Creating a representative Network 3. Using penalties to define operating rules
General Operation of system must be controlled Generally based on: Practical experience Specialist analysis Overall objectives: Optimise utilisation of water resource Minimise cost of operation
Typical aspects Prioritisation of supply to water users Prioritisation of use of water sources Conditions under which inter-reservoir and inter-basin support occurs (i.e. Ntabaleng & Laleni) EWR Requirements (i.e Laleni Hydropower operation) Minimisation of spillage
Selection process Define objectives (scenario matrix) Select initial set of operating rules Implement initial selection in model Undertake analysis and interpret results Evaluate achievement of objectives Reselect operating rules Repeat selection process
2. Creating a representative network model
Identify main physical features Water source Water users Runoff River Recreation Urban Reservoir Irrigation Industrial Ecology
Representative model symbols = Reservoir X = Runoff = Flow route (with sink ) X = Junction node X = Water user X
Resulting network model Urban 4 Recreation Ecology 1 2 3 4 1 3 5 7 2 6 Irrigation Industrial
Demands/Water Use Urban/Industrial: 12 monthly values (monthly distribution) Irrigation: Irrigation blocks i.e. Allocation, irrigation efficiency, return flow, soil characteristics, effective rainfall factors, evaporation, crop types/crop factors, irrigation area
Demands/Water Use Afforestation and Alien Invasive: Time series from Hydrological Analysis EcologicalWater Requirements (EWRs): Range of monthly runoff reference flows & Real Monthly IFR flows (corresponding to reference flows) (show file from Drew)
3. Using penalties to define operating rules
Penalties Tool for implementing selected operating rules in model Dimensionless value assigned by analyst to system components: Channels: for every unit of flow Reservoirs: for every unit of water in storage Interpreted by comparing relative size Basis of model flow-routing solution
Penalty selection (1 of 3) P = 1 2 m3/s P = 5 Flow = 2 m3/s User Flow P = 10 2 m3/s P = 5 Flow = 0 m3/s User Flow P = 10 2 m3/s P = 11 Flow = 2 m3/s User Flow
Penalty selection (2 of 3) 2 m3/s P = 5 P = 1 User 1 Flow 1 = 2 m3/s Flow 2 = 2m3/s Flow 1 2 m3/s P = 15 User 2 Flow 2 2 m3/s P = 5 P = 10 User 1 Flow 1 = 0 m3/s Flow 2 = 2m3/s Flow 1 2 m3/s P = 15 User 2 Flow 2 2 m3/s P = 5 P = 20 User 1 Flow 1 = 0 m3/s Flow 2 = 0m3/s Flow 1 2 m3/s P = 15 User 2 Flow 2
Penalty selection (3 of 3) P = 10 2 m3/s P = 5 A User Flow 1 Flow 3 Flow 1 = 0 m3/s Flow 2 = 2 m3/s Flow 3 = 2 m3/s P = 1 B Flow 2 P = 1 2 m3/s P = 5 A User Flow 1 Flow 3 Flow 1 = 2 m3/s Flow 2 = 0 m3/s Flow 3 = 2 m3/s P = 10 B Flow 2
Water resource system Runoff 30 m3/s (Pri. 8) 10 m3/s 1 m3/s 0.5 m3/s (Pri. 5) (Pri. 4) (Pri. 1) 11.5 Recreation Urban Reservoir 1 m3/s (Pri. 2) Ecology 20 m3/s 1 m3/s (Pri. 7) (Pri. 6) Irrigation 21.0 Industrial 4 m3/s (Pri. 3)
Network model with penalties 10 m3/s 1 m3/s 0.5 m3/s P = 20 P = 200 P = 1200 11.5 P = 1 P = 10 P = 100 P = 400 P = 1000 Urban 4 30 m3/s P = 2 1 m3/s P = 750 Recreation Ecology 1 2 3 4 1 3 5 7 2 6 Industrial Irrigation 4 m3/s P = 500 20 m3/s 1 m3/s P = 5 P = 15 21.0
Case 1: Reservoir in Zone 1 10 m3/s 1 m3/s 0.5 m3/s P = 20 P = 200 P = 1200 Water level 11.5 P = 1 P = 10 P = 100 P = 400 P = 1000 Urban 11.5 4 30 m3/s P = 2 1 m3/s P = 750 Recreation Ecology 1 2 3 4 1 3 5 7 37.5 16.5 5.0 1.0 21.0 2 4.0 6 Industrial Irrigation 4 m3/s P = 500 20 m3/s 1 m3/s P = 5 P = 15 21.0 = channel flow in m3/s 16.5
Case 2: Reservoir in Zone 10 10 m3/s 1 m3/s 0.5 m3/s P = 20 P = 200 P = 1200 11.5 P = 1 P = 10 P = 100 P = 400 P = 1000 Water level Urban 11.5 4 30 m3/s P = 2 1 m3/s P = 750 Recreation Ecology 1 2 3 4 1 3 5 7 17.5 16.5 5.0 1.0 1.0 2 4.0 6 Industrial Irrigation 4 m3/s P = 500 20 m3/s 1 m3/s P = 5 P = 15 21.0 = channel flow in m3/s 16.5
Case 3: Reservoir in Zone 100 10 m3/s 1 m3/s 0.5 m3/s P = 20 P = 200 P = 1200 1.5 P = 1 P = 10 P = 100 P = 400 P = 1000 Water level Urban 1.5 4 30 m3/s P = 2 1 m3/s P = 750 Recreation Ecology 1 2 3 4 1 3 5 7 6.5 6.5 5.0 1.0 0.0 2 4.0 6 Industrial Irrigation 4 m3/s P = 500 20 m3/s 1 m3/s P = 5 P = 15 21.0 = channel flow in m3/s 16.5
Case 4: Reservoir in Zone 400 10 m3/s 1 m3/s 0.5 m3/s P = 20 P = 200 P = 1200 0.5 P = 1 P = 10 P = 100 P = 400 P = 1000 Urban Water level 0.5 4 30 m3/s P = 2 1 m3/s P = 750 Recreation Ecology 1 2 3 4 1 3 5 7 5.5 5.5 5.0 1.0 0.0 2 4.0 6 Industrial Irrigation 4 m3/s P = 500 20 m3/s 1 m3/s P = 5 P = 15 21.0 = channel flow in m3/s 16.5
Case 5: Reservoir in Zone 1000 10 m3/s 1 m3/s 0.5 m3/s P = 20 P = 200 P = 1200 0.5 P = 1 P = 10 P = 100 P = 400 P = 1000 Urban Water level 0.5 4 30 m3/s P = 2 1 m3/s P = 750 Recreation Ecology 1 2 3 4 1 3 5 7 0.5 0.5 0.0 0.0 0.0 2 0.0 6 Industrial Irrigation 4 m3/s P = 500 20 m3/s 1 m3/s P = 5 P = 15 21.0 = channel flow in m3/s 16.5
DWS TRAINING End


")
")
")