Determining Water Resource Classes & Quality Objectives in Mzimvubu Catchment
Explore the process of determining water resource classes and quality objectives in the Mzimvubu Catchment, analyzing consequences on ecosystem services. Methods include stakeholder engagement, quantifying resources, and evaluating scenarios. Socio-economic impacts and ecosystem services are assessed to understand the value of water resources and potential changes.
Download Presentation

Please find below an Image/Link to download the presentation.
The content on the website is provided AS IS for your information and personal use only. It may not be sold, licensed, or shared on other websites without obtaining consent from the author. If you encounter any issues during the download, it is possible that the publisher has removed the file from their server.
You are allowed to download the files provided on this website for personal or commercial use, subject to the condition that they are used lawfully. All files are the property of their respective owners.
The content on the website is provided AS IS for your information and personal use only. It may not be sold, licensed, or shared on other websites without obtaining consent from the author.
E N D
Presentation Transcript
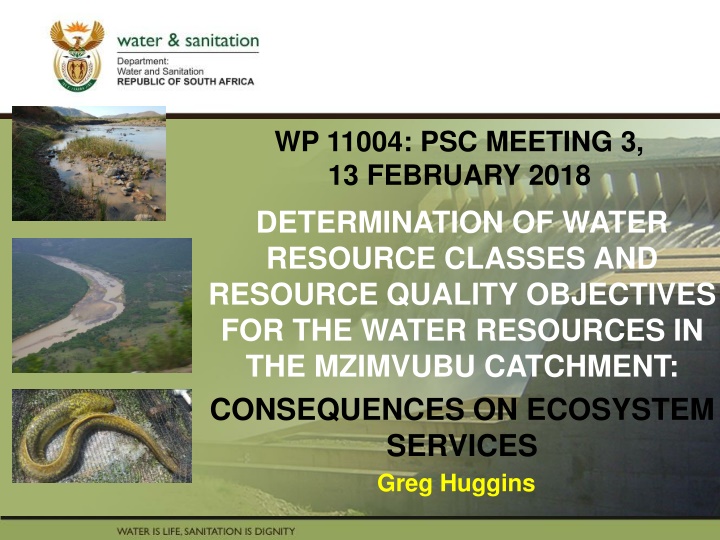
WP 11004: PSC MEETING 3, 13 FEBRUARY 2018 PRESENTATION TITLE DETERMINATION OF WATER RESOURCE CLASSES AND RESOURCE QUALITY OBJECTIVES FOR THE WATER RESOURCES IN THE MZIMVUBU CATCHMENT: CONSEQUENCES ON ECOSYSTEM SERVICES Greg Huggins Presented by: Name Surname Directorate Date
PROJECT PLAN Step 1: Delineate and prioritise RUs and select study sites Step 2: Describe status quo and delineate the study area into IUAs STAKEHOLDER ENGAGEMENT Step 3: Quantify BHNR and EWR Step 4: Identify and evaluate scenarios within IWRM Step 5: Determine Water Resource Classes based on catchment configurations for the identified scenarios Step 6: Determine RQOs (narrative and numerical limits) and provide implementation information Step 7: Gazette Water Resource Classes and RQOs
SOCIO-ECONOMICS Looking at the value of water and measure impact of scenarios. Although they are integrated there are two fundamental pieces of work applied. Look at value of water abstracted and express the return on utilisation - this can be expressed in Rands and in terms of jobs. Look at value of water that remains in the system and what this means for utilization of associated goods and services. This is expressed as an order of magnitude impact of scenarios against a status quo reference point.
WHAT ARE ECOSYSTEM SERVICES Ecosystem Services (previously called EGSAs) are the goods and services provided by the river (and associated ecological systems) that result in a value being produced for consumers. Provisioning services = ecosystem goods , such as foods, fuels, fibres, medicine, etc., that are in many cases directly consumed. Other services include: cultural services (ritual use of rivers, aesthetic or historical importance) regulating services (e.g. water quality inputs), and supporting services (e.g. nutrient formation)
METHODS For the Mzimvubu Catchment, the following methods were used to generate a picture of the most important Ecosystem Services that are associated with the riverine system and may be subject to change under a potential range of operational scenarios. Literature survey Census information Analysis of maps and Google Earth images Interviews in the catchment where priorities were identified.
PROCESS Evaluate changes to Ecosystem Services against scenarios in expert workshop format. The specialists (biophysical) identify the potential change that each of the key Services may undergo. The potential change is used as a factor in later calculations. For example,, no change = 1, a 50% increase = 1.5, and a 20% decrease = 0.8. E.g.: Each river reach, estuary, and each scenario are analysed to determine how Services may react.
DETERMINING ECOSYSTEM SERVICES CONSEQUENCES OF SCENARIOS Supporting Supporting Cultural Regulating Cultural Consequences Regulating Consequences Provisioning Ecosystem Services Status quo Provisioning Model scenarios PREDICT CONSEQUENCES Provide score to indicate relative change from present Identify specific Services Above process undertaken for: Each reach represented by EWR site & Each scenario THEN INTEGRATED (USING A WEIGHTED SYSTEM) TO PROVIDE A SYSTEMS CONSEQUENCE
ECOSYSTEM SERVICES SCENARIO SCORING FOR MZIMEWR 1 Sc 2a, 2b, 32, 33 Sc 41, 42, 51, 52, 53 Sc 2c, 61 Sc 62,63 Services SC 54 Sc 65 Sc 69, 70 Normative Score 0,83 0,54 0,92 0,70 1,04 1,03 1,02 0,84 1,04 1,03 1,02 0,84 0,73 1,11 0,88 0,60 0,92 1,04 0,88 0,64 1,00 1,01 0,80 0,85 0,96 1,06 0,80 0,66 Provisioning Regulating Cultural Supporting Weighted Score 0,33 0,11 0,23 0,11 0,77 0,42 0,21 0,26 0,13 1,00 0,42 0,21 0,26 0,13 1,00 0,29 0,22 0,22 0,09 0,83 0,37 0,21 0,22 0,10 0,89 0,40 0,20 0,20 0,13 0,93 0,38 0,21 0,20 0,10 0,90 Provisioning Regulating Cultural Supporting Total
ECOSYSTEM SERVICES SCENARIO SCORING FOR MZIMEWR 4 Sc 32, 33, 41, 42, 51 52 53 Sc 2a, 2b Sc 2c, 61 Sc Sc Sc 62 Sc 65 Sc 69,70 Services Sc 63 Normative Score 1,02 1,02 1,02 1,06 0,88 0,94 0,94 0,99 1,06 Provisioning 1,07 1,06 1,09 1,09 1,04 1,06 1,06 1,10 1,10 1,06 1,04 1,10 1,06 1,10 1,06 1,10 1,06 1,10 Regulating Cultural 0,89 0,89 0,89 1,00 0,88 0,90 0,90 0,95 0,95 Supporting Weighted Score 0,41 0,41 0,41 0,43 0,35 0,38 0,38 0,40 0,42 Provisioning 0,21 0,27 0,22 0,22 0,21 0,27 0,27 0,28 0,22 0,27 0,21 0,28 0,21 0,28 0,21 0,28 0,21 0,28 Regulating Cultural 0,13 1,02 0,13 0,13 0,15 1,02 1,02 1,06 0,13 0,97 0,14 1,00 0,14 1,00 0,14 1,03 0,14 1,05 Supporting Total
ECOSYSTEM SERVICES SCENARIO SCORING FOR EWR1 LALINI Sc 2a, Sc 2b, Sc 41, Sc 51, Sc 53 SC 61, 63, 65 , 69 SC 2c, 70 Sc 33, Sc 42, Sc 52. Sc 54 Services Normative Score 0,71 0,54 0,84 0,70 1,00 0,97 1,00 0,85 0,80 0,80 0,80 0,80 0,80 0,80 0,80 0,80 0,71 0,54 0,20 0,70 Provisioning Regulating Cultural Supporting Weighted Score 0,28 0,11 0,21 0,11 0,71 0,40 0,19 0,25 0,13 0,97 0,32 0,32 0,16 0,16 0,20 0,20 0,12 0,12 0,80 0,80 0,28 0,11 0,05 0,11 0,55 Provisioning Regulating Cultural Supporting Total
ECOSYSTEM SERVICES SCENARIO SCORING FOR MZIMVUBU ESTUARY Sc 53=Sc 54 Sc 61 Sc 62 Sc 63 Sc 65 Sc 69 Normative Score Provisioning 1,00 1,00 1,00 1,00 1,00 1,00 Regulating 0,99 0,99 1,01 0,99 0,99 0,99 Cultural 1,00 1,23 1,20 1,23 1,25 1,25 Weighted Score Provisioning 0,20 0,20 0,20 0,20 0,20 0,20 Regulating 0,39 0,39 0,41 0,39 0,39 0,39 Cultural 0,40 0,49 0,48 0,49 0,50 0,50 Supporting Total 0,99 1,08 1,09 1,08 1,09 1,09
INTEGRATED RESULTS FOR SCENARIOS
CONCLUSIONS At MzimEWR1 scenarios are mostly negative. At MzimEWR4 scenarios are mostly marginally positive or neutral. At EWR1 Lalini scenarios are negative For the Estuary the scenarios are neutral or marginally positive. Overall results suggest Sc 65 and Sc 69 show least impact on Ecosystem Services, with Sc 54, Sc 62 and Sc 63 being acceptable.

