Developing Renewable Energy Value Chain in South Africa
Explore the renewable energy industry in South Africa, focusing on localizing the value chain. Analyze the country's current renewable energy generation capacity, licensing exemptions, and power generation trends. Learn about efforts to enhance renewable energy sources like solar PV, wind, and bioenergy for sustainable growth.
Download Presentation

Please find below an Image/Link to download the presentation.
The content on the website is provided AS IS for your information and personal use only. It may not be sold, licensed, or shared on other websites without obtaining consent from the author.If you encounter any issues during the download, it is possible that the publisher has removed the file from their server.
You are allowed to download the files provided on this website for personal or commercial use, subject to the condition that they are used lawfully. All files are the property of their respective owners.
The content on the website is provided AS IS for your information and personal use only. It may not be sold, licensed, or shared on other websites without obtaining consent from the author.
E N D
Presentation Transcript
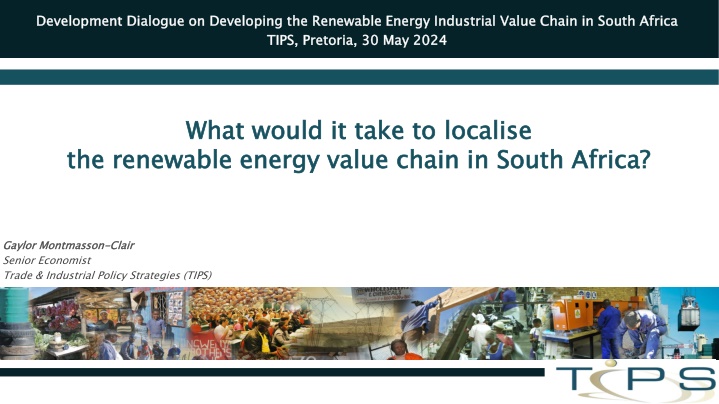
Development Dialogue on Developing the Renewable Energy Industrial Value Chain in South Africa TIPS, Pretoria, 30 May 2024 Development Dialogue on Developing the Renewable Energy Industrial Value Chain in South Africa TIPS, Pretoria, 30 May 2024 What would it take to the renewable energy value chain in South Africa? What would it take to localise the renewable energy value chain in South Africa? localise Gaylor Montmasson Senior Economist Trade & Industrial Policy Strategies (TIPS) Gaylor Montmasson- -Clair Clair
South Africas renewable energy generation capacity (in MW) South Africa s renewable energy generation capacity (in MW) 12,000 18% 17% 11,000 16% 10,000 15% 14% Share of renewable energy in total installed capacity 9,000 Renewable energy generation capacity (in MW) 13% 8,000 12% 11% 7,000 10% 6,000 9% 8% 5,000 7% 4,000 6% 5% 3,000 4% 2,000 3% 1900 1508 1359 2% 1222 1211 1,000 719 1% 678 498 304 117 2023 103 2019 0 0% 18 6 4 2010 2011 2012 2013 2014 2015 2016 2017 2018 2020 2021 2022 Renewable hydropower Bioenergy Wind energy Solar PV CSP Annual renewable energy addition (in MW) Share of RE (%) Source: Montmasson-Clair, based on IRENA data
Power generation capacity registered with NERSA under licensing exemption conditions Power generation capacity registered with NERSA under licensing exemption conditions Installed, cumulative renewable energy generation capacity in SA (in MW) Installed, cumulative renewable energy generation capacity in SA (in MW) 12,000 3,000 11,000 10,000 2,500 2,467 12 August 2021: License exemption increased from <1 MW to <100 MW 9,000 Total registrations: 2021: 135 MW 2022: 1664 MW 2023: 4530 MW 8,000 MW Generation Capacity 15 December 2022: License requirement removed 2,000 7,000 6,000 1,500 5,000 4,000 1,000 3,000 908 749 2,000 605 606 550 500 1,000 446 436 0 Dec-22 Dec-23 Sep-22 Mar-23 Sep-23 Mar-24 Jul-22 Oct-22 May-23 Jul-23 Oct-23 Nov-22 Nov-23 Aug-22 Jan-23 Feb-23 Apr-23 Jun-23 Aug-23 Jan-24 Feb-24 Apr-24 49 42 32 32 24 Q4 12 Q1 11 Q3 9 8 0 Q1 Q2 Q2 Q3 Q4 Q1 Q2 Q3 Q4 Q1 Q2 Q3 Q4 Q1 Utility-scale CSP Other utility-scale capacity Utility-scale wind Private solar PV Utility-scale solar PV 2020 2021 2022 2023 2024 <1 1-10 10-50 50-100 >100 Total Source: Montmasson-Clair, based on Eskom data Source: Montmasson-Clair, based on NERSA data
Solar PV value chain Modules: ArtSolar, Seraphim*, Ener-G Africa Wind energy value chain Concrete towers: Concrete Units, Nodex/WBHO, Colossus* Battery storage value chain Mineral refining: MMC (manganese metal), Thakadu (nickel sulphate), Hulamin (aluminium foil), vanadium pentoxide (Bushveld Minerals) Casings, modules and cooling: multiple steel, aluminium and plastics suppliers, machining operations and aluminium Hulamin, Wispeco). LIB Pack assembly: Balancell, Blue Nova, Freedom Won, Hubble Lithium, Maxwell & Sparks, Polarium, Rubicon, SolarMD, Creslow Energy Solutions BMS/EMS: Balancell, Blue Nova, Freedom Won, Hubble Lithium, Maxwell & Sparks, Polarium, Rubicon, SolarMD LIB recycling: Circular Energy, Reclite, eWaste Africa Second-life LIB: Revov Mounting structures and trackers: ModeTech, Caracal Engineering, K2 Systems, PVH, Barnes Tubing, IMAB Technologies, Lumax Energy, KD Solar Inverters: Rubicon (MLT), Microcare, Ario# Steel towers: GRI Towers extruders (e.g., Primary steel: ArcelorMittal South Africa Tower internals: ModeTech Transformers, Transformers: ArmCoil Afrika, Zest Weg Actom, Reliable Cables: Aberdare, CBI African Cables, SOEW Anchor cages and extenders: Modetech Fasteners: CBC Fasteners, Impala Bolts & Nuts Transformers: Actom, Powertech, Matlakse, SGB- Smit Power Matla Fasteners: SA Bolts Combiner boxes: HellermannTyton, Weidmuller and Allbro Switchgears: RWW Engineering and Switchgear Unlimited VRFB electrolyte: Bushveld Energy Cables: CBI African Cables, M-tech, Aberdare VRFB assembly: Bushveld Energy (Enerox) Note: *mothballed; #awaiting certification 5
SAs imports of solar panels, lithium SA s imports of solar panels, lithium- -ion batteries and inverters ion batteries and inverters 1.8 US$ billion 1.7 1.6 1.5 1.4 1.3 1.2 1.1 1.0 0.9 0.8 0.7 0.6 0.5 0.4 0.3 0.2 0.1 0.0 Q1 Q2 Q3 Q4 Q1 Q2 Q3 Q4 Q1 Q2 Q3 Q4 Q1 Q2 Q3 Q4 Q1 Q2 Q3 Q4 Q1 Q2 Q3 Q4 Q1 Q2 Q3 Q4 Q1 Q2 Q3 Q4 Q1 Q2 Q3 Q4 Q1 Q2 Q3 Q4 Q1 Q2 Q3 Q4 Q1 Q2 Q3 Q4 Q1 2012 2013 2014 2015 2016 2017 2018 2019 2020 2021 2022 2023 2024 Inverters Solar cells & panels Lithium-ion cells & batteries Source: Montmasson-Clair, based on TradeMap and Quantec data
Source: Montmasson-Clair, based on TradeMap and Quantec data
Big wins Big wins LIB cells Value added mineral products (Mn, Ni, V, Al, etc.) Wafer & ingots High stakes, high rewards Polysilicon Solar cells Tower (concrete) Mounting structures and trackers High stakes, high rewards Solar modules economic benefits Socio- -economic benefits Step-up transformers (Solar PV) Inverters (string) Tower internals Tower (steel) Hubs and nacelle Step-up transformers (Wind) Collector transformers (Solar PV & Wind) Blades Inverters (collector) LV cables (Solar PV) MV cables (Solar PV) LIB components & casing Primary steel (Wind) VRFB stacks Fasteners (Solar PV) Socio Vanadium electrolyte Stealing the blinds Stealing the blinds BMS/EMS Fasteners (Wind) Rigid MV cables (Wind) Flexible MV cables (Wind) VRFB tanks Domestic growth potential Domestic growth potential Source: Montmasson-Clair, based on various sources and interviews 8
Stable demand, breaking away from the historical stop-start pattern, is a fundamental pre-requisite for any successful industrial development strategy A minimum rollout of RE of 3 GW per annum, ramping up to 5 GW per annum by 2030, is necessary to underpin the development of the value chain achieve energy security and climate-related goals) A minimum rollout of RE of 3 GW per annum, ramping up to 5 GW per annum by 2030, is necessary to underpin the development of the value chain (the PCC recommends a rollout of 6-8 GW per year of RE to Compared to its peers, South Africa is considered an attractive location for manufacturing investment in the value chain. However, the extremely competitive nature of the global RE and battery storage industry points to the need for South Africa to put forward a compelling investment case to the market. Ambitious supply-side support is paramount to enhance the competitiveness of locally-manufactured products. The broader VC ecosystem must be geared towards the development of local capacity and capabilities.
Stable demand is a fundamental pre- -requisite for any successful industrial development strategy. Stable demand is a fundamental pre requisite for any successful industrial development strategy. Market demand has, so far, been too inconsistent to support industrialisation. . Market demand has, so far, been too inconsistent to support industrialisation Public sector procurement and policy support haven been insufficiently or inadequately connected to localisation Public sector procurement and policy support haven been insufficiently or inadequately connected to localisation objectives. 1) Demand 1) Demand objectives. Enabling a smooth demand profile requires a consistent rollout of across market segments Enabling a smooth demand profile requires a consistent rollout of across market segments Cross- -cutting issues still hinder demand Cross Physical infrastructure (grid rollout and optimisation mechanisms) Policy and regulation, including market infrastructure Financing mechanisms for industrial, commercial and farming operations, but also households and communities Alternative models for low-income households and community-owned systems Develop downstream demand drivers (power-to-x markets) cutting issues still hinder demand 2) Demand 2) Demand Ambitious large- and small-scale public procurement (REIPPPP, ESIPPPP, SOEs, government depts, municipalities, etc.) and rollout (public structures, un-/under- served communities and households) Medium- and large-scale private sector procurement Small-scale residential, community and commercial/industrial rollout 3) Demand 3) Demand
SA's imports of solar cells, modules & panels SA's imports of solar cells, modules & panels SA's import of wind turbines (in US$ millions) SA's import of wind turbines (in US$ millions) 500 US$ millions 600 US$ millions 580 450 550 400 500 2022: US$ 345 million (R5.6 billion) 2023: US$ 947 million (R17.5 billion) 450 350 400 300 387 380 350 337 250 317 300 200 266 250 150 203 200 100 150 130 50 100 97 50 0 Q1 Q3 Q1 Q3 Q1 Q3 Q1 Q3 Q1 Q3 Q1 Q3 Q1 Q3 Q1 Q3 Q1 Q3 Q1 Q3 Q1 Q3 Q1 Q3 Q1 Q3 Q1 Q3 Q1 14 1 0 1 0 0 2010 2011 2012 2013 2014 2015 2016 2017 2018 2019 2020 2021 2022 20232024 2011 2012 2013 2014 2015 2016 2017 2018 2019 2020 2021 2022 2023 2024 (Q1) Solar PV cells (US$) Solar PV modules and panels (US$) Total (US$) China Denmark Spain Germany Source: Montmasson-Clair, based on TradeMap and Quantec data
In a highly competitive global environment, securing manufacturing in the RE and battery storage value chains must be underpinned by a compelling value proposition In a highly competitive global environment, securing manufacturing in the RE and battery storage value chains must be underpinned by a compelling value proposition Most countries seeking to attract investment in green industries have offered substantial supply in the form of grants, tax incentives and concessional funding Most countries seeking to attract investment in green industries have offered substantial supply- -side support in the form of grants, tax incentives and concessional funding Strategic use of trade instruments Import duty exemption or protection on strategic inputs Enforcement of custom duties and mandatory quality standards on imported goods to prevent the entry of sub- standard products as well as the circumvention of existing tariff protection. Strategic use of trade instruments side support Tax incentive for manufacturing investment in greentech (e.g. 12i) to complement existing measures SEZ value proposition, incl. incentives, Customs Clearance Areas and zero- rated VAT / duties Enhanced testing and certification, esp. for batteries, solar panels, inverters, transformers, cables and fasteners (Regional) value chain deepening Strategic partnerships (SADC, BRICS, AU), particularly in the battery value chain Alignment with connected industries (e.g. mining/beneficiation, steel/aluminium, autos, end-of-life management) (Regional) value chain deepening
Building the skills on the back of a demand led approach Match-making PowerUp platform between education & training providers and industry Standardised trainings & qualifications Pathways from learning to earning (e.g. Yes4Youth) Recognition of Prior Learning Building the skills on the back of a demand- - led approach A heightened focus on supplier development and technology readiness would unlock substantial support for new entrants and emerging suppliers A heightened focus on supplier development and technology readiness would unlock substantial support for new entrants and emerging suppliers OEM-led cluster platform linking the different parts of the value chain (OEMs, Tier 1 and Tier 2 companies) to support supplier development, along with the dtic s Strategic Partnership Programme Transformation Fund to support new entrants Drive an inclusive value chain Decent work framework linked to public procurement and state support Gender inclusivity action plan Clear guidelines and best practice for ESOPs + pilot programmes B-BBEE sector specific scorecard Drive an inclusive value chain Increased focus on technology commercialisation Access to machinery, equipment and expertise (e.g. Manufacturing Technology Centre) Mechanisms & platforms to de-risk trials and localise new technologies
Global imports of lithium-ion batteries (in US$ billion) Global manufacturing capacity (% of total) 25 US$ billions Hydrogen electrolyzer 23 Wind turbine nacelle 20 Nickel sulfate Cobal sulfate 18 Lithium hydroxide and carbonate 15 Battery separator 13 Battery electrode 10 Battery anode 8 Battery cathode Battery cell 5 Polysilicon 3 Solar wafer & ingot 0 Solar cell Solar module 0% 10% 20% 30% 40% 50% 60% 70% 80% 90% 100% 2021 2022 2023 China US Euope Japan South Korea Rest of the world Source: Montmasson-Clair, based on TradeMap and Quantec data Source: Bloomberg, 2024
Trade & Industrial Policy Strategies Trade & Industrial Policy Strategies Supporting policy development through research and dialogue Supporting policy development through research and dialogue www.tips.org.za www.tips.org.za Gaylor Montmasson Senior Economist gaylor@tips.org.za +27 12 433 9340 / +27 71 31 99 504 Gaylor Montmasson- -Clair Senior Economist gaylor@tips.org.za +27 12 433 9340 / +27 71 31 99 504 | Clair | @Gaylor_MC @Gaylor_MC File:LinkedIn Logo.svg - Wikipedia Jacques Kelly: Documents reveal the origins of several Baltimore neighborhoods | Twitter logo, Twitter funny, Social media
