Development of Net Sales in Food Division
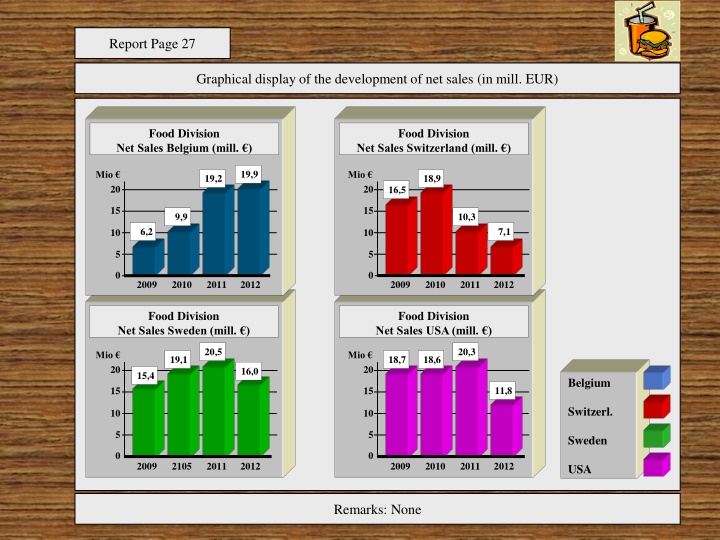
Graphical display of the net sales development in millions of EUR for the Food Division across Belgium, Switzerland, Sweden, and USA from 2009 to 2012. The data is presented in a clear format without unnecessary elements, providing a visual overview of sales trends over the years.

Download Presentation

Please find below an Image/Link to download the presentation.
The content on the website is provided AS IS for your information and personal use only. It may not be sold, licensed, or shared on other websites without obtaining consent from the author.If you encounter any issues during the download, it is possible that the publisher has removed the file from their server.
You are allowed to download the files provided on this website for personal or commercial use, subject to the condition that they are used lawfully. All files are the property of their respective owners.
The content on the website is provided AS IS for your information and personal use only. It may not be sold, licensed, or shared on other websites without obtaining consent from the author.
E N D
Presentation Transcript
Report Page 27 Graphical display of the development of net sales (in mill. EUR) Food Division Net Sales Belgium (mill. ) Food Division Net Sales Switzerland (mill. ) 19,9 Mio Mio 19,2 18,9 20 20 16,5 15 15 9,9 10,3 6,2 7,1 10 10 5 5 0 0 2009 2010 2011 2012 2009 2010 2011 2012 Food Division Net Sales Sweden (mill. ) Food Division Net Sales USA (mill. ) 20,5 20,3 Mio Mio 19,1 18,7 18,6 20 20 16,0 15,4 Belgium 11,8 15 15 Switzerl. 10 10 5 5 Sweden 0 0 2009 2105 2011 2012 2009 2010 2011 2012 USA Remarks: None
No marcos alrededor de valores No decoraci n No pseudo-3D Report Page 27 "Food Division es un t tulo Graphical display of the development of net sales (in mill. EUR) No marcos y bordes Food Division Net Sales Belgium (mill. ) Food Division Net Sales es un t tulo Net Sales Switzerland (mill. ) 19,9 Mio Mio 19,2 18,9 20 20 16,5 No colores sin significado 15 15 9,9 10,3 6,2 7,1 10 10 No lineas horicontales 5 5 0 0 2009 2010 2011 2012 2009 2010 2011 2012 "Mill. es reduntante No ejes verticales (Y) Food Division Net Sales Sweden (mill. ) Food Division Net Sales USA (mill. ) 20,5 20,3 Mio Mio 19,1 18,7 18,6 20 20 16,0 15,4 Belgium 11,8 15 15 Switzerl. 10 10 5 5 Sweden 0 0 2009 2010 2011 2012 2009 2010 2011 2012 USA No fuente con serifs No use leyendas Remarks: None
Food Division Net Sales in mill. EUR Belgium Switzerland 19,9 19,2 18,9 16,5 9,9 10,3 6,2 7,1 2009 2010 2011 2012 2009 2010 2011 2012 Sweden USA 20,5 20,3 19,1 18,7 18,6 16,0 15,4 11,8 2009 2010 2011 2012 2009 2010 2011 2012
In year 9 (Budget) we plan a budget increase of six percent 1 Mensaje AFG Division Net Sales in mill. EUR Year 1 Year 9 (Budget) 2 T tulo 5 Acentuaci n 402 388 366 +6% 330 333 327 307 309 305 3 Gr fico 1 2 3 4 5 6 7 8 Budget 4 Pie de p gina Source: Published Yearly Reports year 1 to year 8 (nominal) and Budget
Managers can only understand the shown information quickly (like road maps) if we use a consistent notation Conceptual Sales in Euro/Period Headcount in FTE Production in units Percentages as Rentabilities Prices, Costs in Euro/Unit ACT ACT - BUD
Business charts with high information density give a better overview by allowing comparisons Profit by Divisions in mill. EUR Offices Europe Q1 A1 A1 A1 B1 B2 C1 C2 A1 -4 13 3 12 A1 -6 -1 -1 41 BX BX BX BX 12 3 8 C1 C1 C1 12 10 C1 -5 -3 -8 40 C2 C2 C2 C2 10 9 12 14 DL DL DL 3 DL DA DB -8 3 DM DM DM DM -3 3 18 GA GA GA 3 GA 12 22 6 S Berlin Bern D sseldorf -23 Essen GB GB GB GB A1 34 A1 B1 B2 C1 C2 -5 -6 A1 A1 52 45 -12 -6 23 BX BX BX -12 -12 5 11 C1 C1 C1 -4 12 3 37 C2 C2 C2 -7 4 44 29 DL DL DL DA DB 12 25 9 34 DM DM DM -6 32 3 -3 GA GA GA S 12 22 Frankfurt Innsbruck M nchen -3 -10 N rnberg GB GB GB -23 A1 B1 B2 C1 C2 A1 A1 A1 A1 -4 -5 -6 6 7 8 9 -4 BX BX BX BX -9 11 10 C1 C1 C1 C1 3 7 5 C2 7 C2 C2 C2 -5 -5 44 10 DL DL DL DL DA DB -11 9 12 DM 5 DM DM DM -5 -6 3 3 GA GA GA GA S 22 Salzburg St. Gallen Wien -3 -3 Z rich -9 GB GB GB GB Source: T56 vom 23.4.
Company: ALPHA AG Unit: Total Net Sales Development of branches in D-A-CH Type of report: Variances LY-ACT-BUD April Date: 6th of May Actual month: Act Last Year Budget Act Act/Act Last year Act/Budget Region Variance Var. in % Variance Var. in % EUR EUR EUR EUR EUR -22,84% -23,28% -40,24% -25,12% -18,49% -27,48% -23,12% 9,53% -13,96% 20,65% -57,64% -8,32% 16.60% 47.92% -47,59% -36.75 19.37% -9.66 17.75% 1.82% 10.33% 39.63% -30,76 15.93% Total Subsidary Hamburg Subsidary M nchen Subsidary M nchen Subsidary Dresden Subtotal Germany Subsidary Wien Subsidary Bregenz Subtotal Austria Subsidary Z rich Subsidary Lausanne Subtotal Switzerland 17277057 5857553 3351702 1653830 1588177 12451262 1581124 616595 2197719 1655555 972521 2628077 13623362 3038115 3821627 1957888 1084500 9902129 1032335 663252 1695587 1430615 595031 2025646 13330151 4493907 2002859 1238448 1294517 9029731 1215568 675341 1890908 1997509 412003 2409512 -3946907 -1363646 -1348843 -415382 -293660 -3421531 -365556 58745 -306811 341954 -560518 -218565 -293212 1455792 -1818768 -719440 210017 -872398 183233 12088 195321 566894 -183028 383866 Responsible: Peter Maier, CFN, Tel. 0956, peter.maier@alpha.com KR-01 Page: 56
No use terminos como unidad, valor, estructura, desarollo etc. No fuente como serifs No sunrayado si no hay sigificado Company: ALPHA AG Unit: Total Net Sales Development of branches in D-A-CH Type of report: Variances LY-ACT-BUD April Date: 6th of May Actual month: EUR es parte del t tulo Act Last Year Budget Act Act/Act Last year Act/Budget Presantaci n en mil Euros mas que suficiente para un Region Variance Var. in % Variance reporte de management Var. in % Total tiene un nombre! EUR EUR EUR EUR EUR -22,84% -23,28% -40,24% -25,12% -18,49% -27,48% -23,12% 9,53% -13,96% 20,65% -57,64% -8,32% 16.60% 47.92% -47,59% -36.75 19.37% -9.66 17.75% 1.82% 10.33% 39.63% -30,76 15.93% Total Subsidary Hamburg Subsidary M nchen Subsidary M nchen Subsidary Dresden Subtotal Germany Subsidary Wien Subsidary Bregenz Subtotal Austria Subsidary Z rich Subsidary Lausanne Subtotal Switzerland 17277057 5857553 3351702 1653830 1588177 12451262 1581124 616595 2197719 1655555 972521 2628077 13623362 3038115 3821627 1957888 1084500 9902129 1032335 663252 1695587 1430615 595031 2025646 13330151 4493907 2002859 1238448 1294517 9029731 1215568 675341 1890908 1997509 412003 2409512 -3946907 -1363646 -1348843 -415382 -293660 -3421531 -365556 58745 -306811 341954 -560518 -218565 -293212 1455792 -1818768 -719440 210017 -872398 183233 12088 195321 566894 -183028 383866 Lineas adicionales ayudan a ler las informaciones Responsible: Peter Maier, CFN, Tel. 0956, peter.maier@alpha.com KR-01 Page: 56 Notaci n unificado para regiones, sucursales, divisiones No cambie el concepto de las columnas sin noticia No sombra, trama, relleno sin sigificado Necesita dos digitos despieus del coma?? Con alineaci n a la derecha de los t tulos de columnas pueda evitar los bordes verticales
Acentuacin adicional ayuda en listados con muchas p ginas ALPHA AG Net Sales in Mill. EUR Regions in D-A-CH Varaiance report LY-ACT-BUD January April 6th of May LY ACT - LY of LY ACT ACT - BUD var of BUD BUD Region var Hamburg M nchen D sseldorf Dresden Germany 5.9 3.4 1.7 1.6 12.5 -1.4 -1.3 -0.4 -0.3 -3.4 4.5 2.0 1.2 1.3 9.0 1.5 -1.8 -0.7 0.2 -0.9 3.0 3.8 2.0 1.1 9.9 -23% -40% -25% -18% -27% 48% -48% -37% 19% -10% Wien Bregenz Austria 1.6 0.6 2.2 -0.4 0.1 -0.3 1.2 0.7 1.9 0.2 0.0 0.2 1.0 0.7 1.7 -23% 10% -14% 18% 2% 10% Z rich Lausanne Switzerland 1.7 1.0 2.7 0.3 -0.6 -0.2 2.0 0.4 2.4 0.6 -0.2 0.4 1.4 0.6 2.0 21% -58% -8% 40% -31% 16% D-A-CH 17.3 -3.9 13.3 -0.3 13.6 -23% 2% Responsible: Peter Maier, CFN, Tel. 0956, peter.maier@alpha.com KR-01 Page: 56


 we plan a budget increase")